Fig. 3.

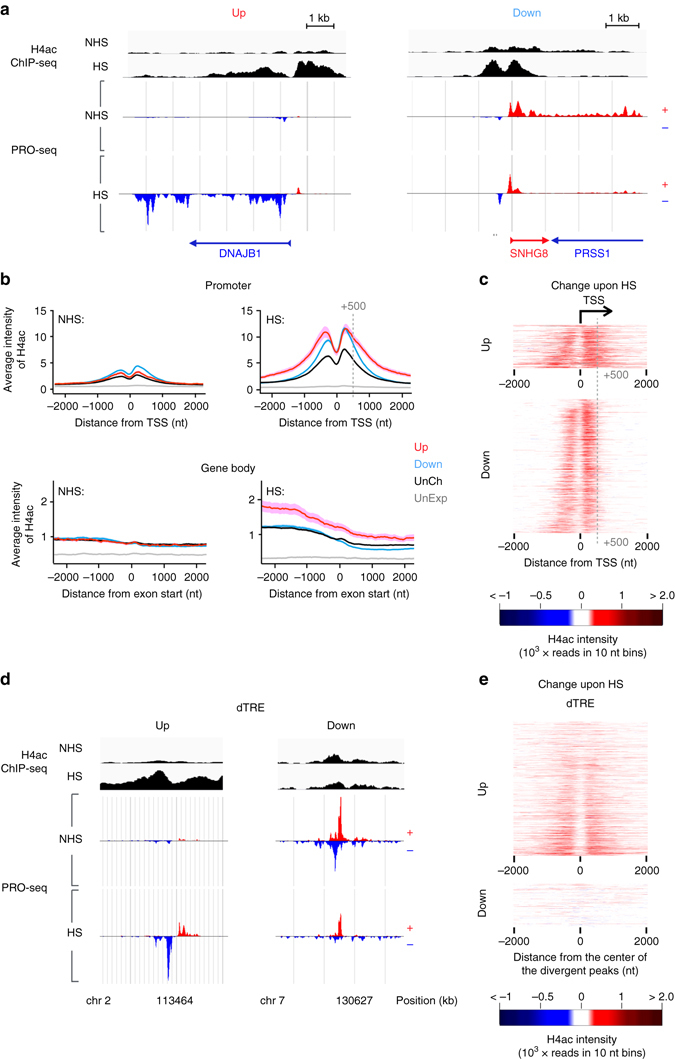
The state of histone H4 acetylation changes in cells exposed to acute stress. a Genome browser images of heat-induced (DNAJB1) and heat-repressed (SNHG8) genes, showing the histone H4 acetylation (black) and transcription from plus (red) and minus (blue) strands prior to (NHS) and upon (HS) heat stress. b Average ChIP-seq intensity of histone H4 acetylation at promoters (upper panels) and gene bodies (lower panels) of genes grouped by their transcriptional response. c The change in histone H4 acetylation upon stress at individual promoters of up- and downregulated genes. The grey dashed line in (b, c) marks the +500 nt position from TSS. d Genome browser images of histone H4 acetylation at dTREs with upregulated (left) and downregulated (right) Pol II density upon stress. e The change in histone H4 acetylation upon stress at individual up- or downregulated dTREs
