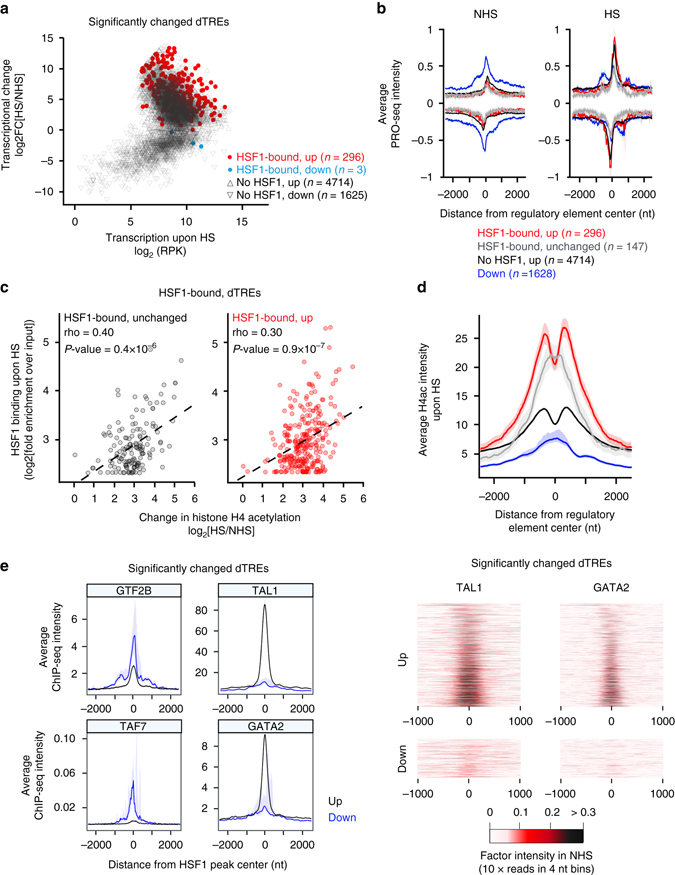
Fig. 6.

Lineage-specific transcription factors prime enhancers for transcriptional induction. a Transcriptional change of significantly changed dTREs plotted as function of transcription level upon stress. The HSF1-bound upregulated dTREs are indicated with red, the HSF1-bound downregulated dTREs with blue closed circles. The numbers of HSF1-targeted or un-targeted dTREs are indicated. b PRO-seq profile of indicated dTREs in NHS and HS conditions. c HSF1 binding intensity as the function of heat-induced change in the histone H4 acetylation at individual dTREs. The coefficients (rho) and P-values are according to Spearman’s rank correlation. The correlation lines are fitted for linear regression. d Average histone H4 acetylation at indicated dTREs upon HS. e Left panels: Average ChIP-seq intensity of GTF2B, TAF7, TAL1 and GATA2 at up- and downregulated dTREs. Right panels show heatmaps of TAL1 and GATA2 at up- and downregulated dTREs. ChIP-seq data sets for GTF2B, TAF7, GATA2 and TAL1 are from the ENCODE55
