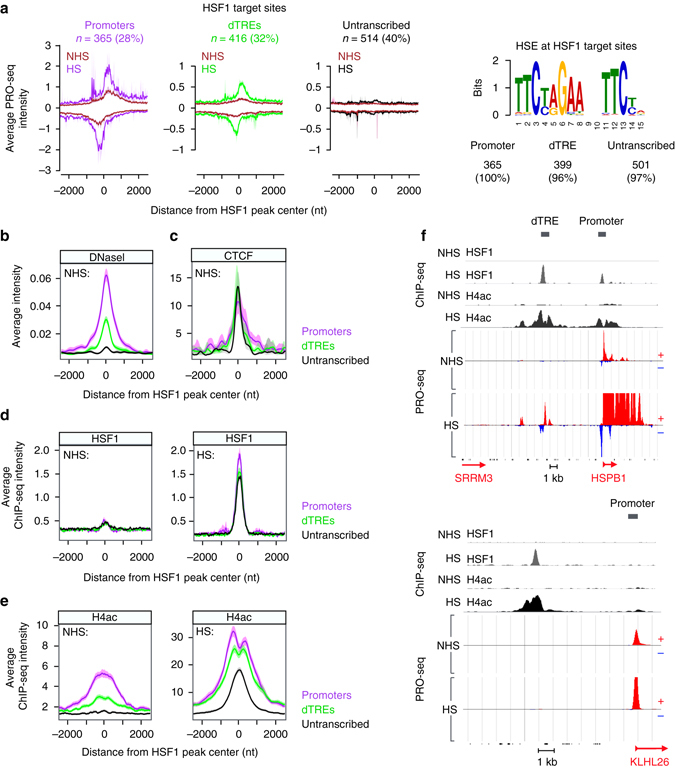
Fig. 7.

HSF1 binds to regions that are devoid of initiating Pol II but gain hyper-acetylation at histone H4 upon stress. a Left panels: Average Pol II density at the HSF1-bound promoters, dTREs and untranscribed genomic regions. N indicates the number, and percentage the share, of HSF1 target sites in respective category. The right panel shows the number and percentage of HSF1 target sites that contain a MEME-ChIP identified HSE (Supplementary Methods). b–e Average intensities of (b) DNaseI sensitivity, (c) CTCF ChIP-seq, (d) HSF1 ChIP-seq and (e) histone H4 acetylation ChIP-seq at HSF1-targeted promoters (purple), dTREs (green) and untranscribed regions (black). f Genome browser examples of a promoter and a dTRE (upper panel), and an untranscribed genomic region (lower panel) that are bound by HSF1 upon heat shock. HSF1 binding (gray), histone H4 acetylation (black) and transcriptionally engaged Pol II (red and blue) are shown in NHS and HS conditions. Data sets of DNaseI sensitivity and CTCF ChIP-seq (Broad institute) were obtained from the ENCODE55
