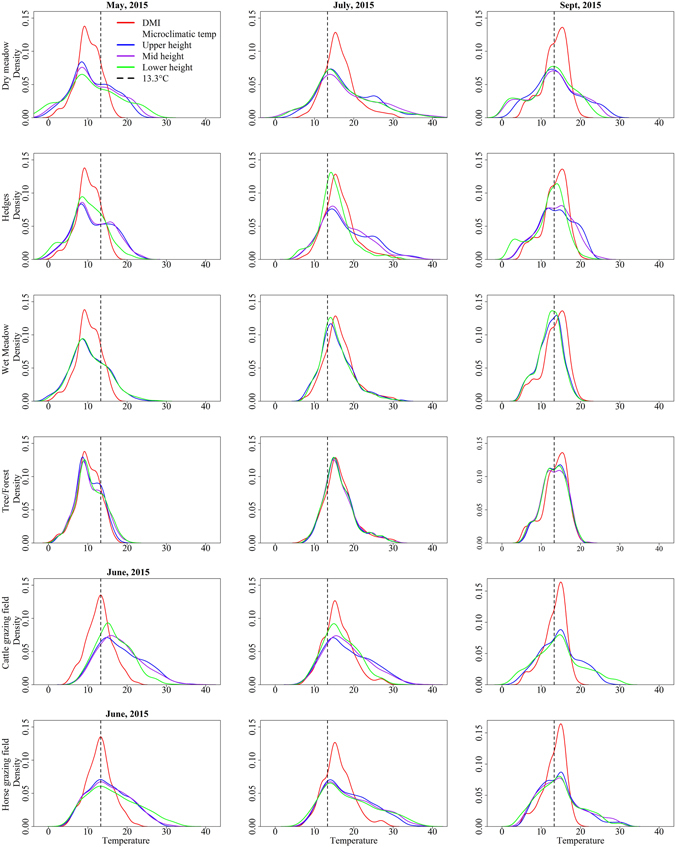
Figure 1.

Hourly temperatures measured at six different microclimatic habitats and from the weather stations of the Danish Meteorological Institute (DMI). For illustrative purposes, only the months May, (June, for horse and cattle fields), July and September are depicted. The vertical (black dashed) line is the threshold temperature for pathogen development (Schmallenberg virus, 13.3 °C). Data from cattle and horse fields were available from 4th June - 31st October 2015, whereas data from other habitats were available from 1st May –31st October 2015. The temperature variation was considerably higher in microclimatic habitats, and differences were more evident in spring (May or June) and autumn (September). The dry meadow, horse field and cattle field were warmer than other habitats.
