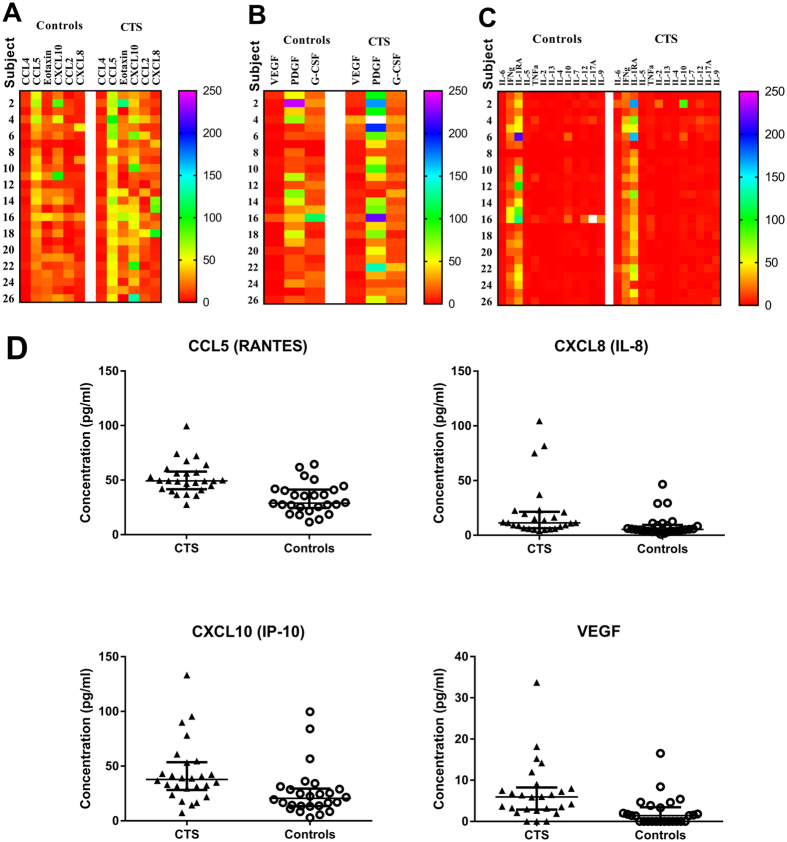
Figure 1.
Serum cytokine/chemokine levels in CTS patients. Heat maps comparing the expression profile of control and CTS serum cytokines, which are grouped as (A) Chemokines; (B) Growth factors; and (C). Cytokines. Values are median cytokine concentration (pg/ml), with red indicating lowest levels, blue-purple indicating highest levels, and yellow-green indicating median levels. (D) Serum CCL5, CXCL8, CXCL10 and VEGF levels are significantly increased in CTS patients (n = 26) relative to healthy controls (n = 26). Lines represent the median and interquartile range.

