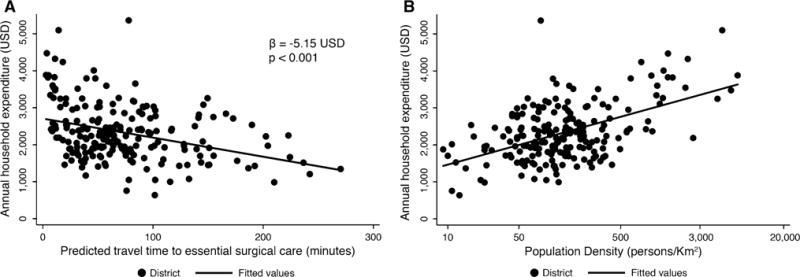
Fig. 1.

a Scatter plot with fitted line demonstrating an inverse relationship between total household expenditure and travel time to emergency surgical care. b Scatter plot with fitted line demonstrating a positive relationship between total household expenditure and population density. Note population density is expressed on a log scale
