
Fig. 6.
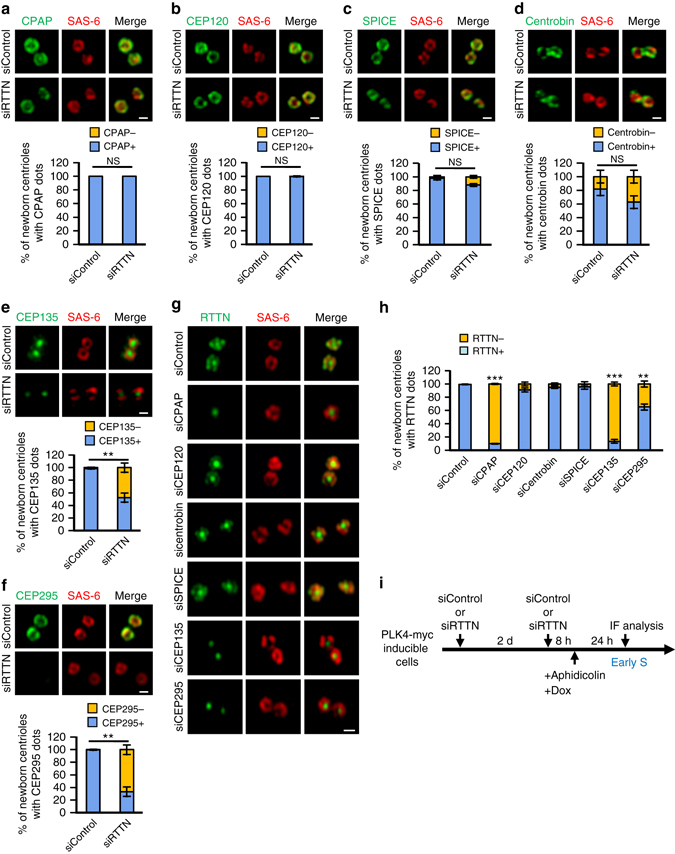
Delineation of the RTTN-mediated centriole elongation pathway. a–f PLK4-myc-inducible cells were treated with siControl or siRTTN as shown in i and analyzed by confocal fluorescence microscopy using antibodies against SAS-6 a–f, CPAP a, CEP120 b, SPICE c, centrobin d, CEP135 e, or CEP295 f, and the results were quantified. Error bars represent the mean ± s.d. (n = 3 independent experiments with 100 cells scored per experiment). g PLK4-myc-inducible cells were treated with siRNAs against CPAP, CEP120, SPICE, centrobin, CEP135, or CEP295 as shown in i, and analyzed by confocal fluorescence microscopy using the indicated antibodies. h Histogram illustrating the percentages of newborn centrioles with RTTN dots. Error bars represent the mean ± s.d. (n = 3 independent experiments with 100 cells scored per experiment). **P < 0.01; ***P < 0.001; NS, not significant (two-tailed t-test). i Schematic of the procedure used to analyze the recruitment of centriolar proteins in siRNA-treated PLK4-myc-inducible cells. Scale bar, 0.5 μm