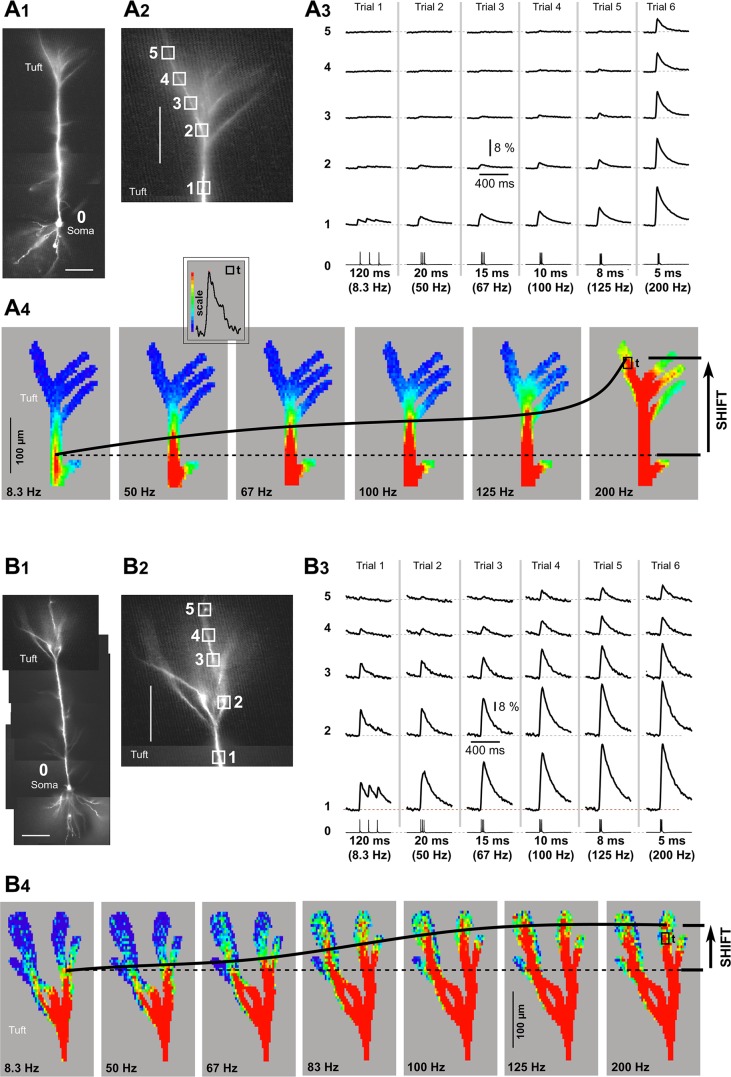
Fig. 2.
Advancing Ca2+ front in the apical tuft. A1: composite photograph of a pyramidal cell. Scale, 100 µm. A2: apical tuft region with marked ROIs. Scale, 100 µm. A3: triplets of APs were recorded whole cell from the soma (ROI 0) and AP-Ca2+ optically from apical tuft nexus (ROI 1) and apical tuft dendrite (ROIs 2–5). The ISI was varied in consecutive sweeps, from 120 ms (8.3 Hz, trial 1) to 5 ms (200 Hz, trial 6). A4: multisite display of Ca2+ imaging data. Signal amplitude is coded by color as shown in inset (“scale”). The peak amplitude at critical frequency (200 Hz) in the apical tuft branch is used to set the red scale value. The actual pixel used for calibration is marked by box (“t”). Dashed horizontal line indicates position of the leading edge of the Ca2+ front at 8.3 Hz. Thick black line marks displacement of the Ca2+ front with increasing frequencies. B1–B4: same as in A1–A4 except for a different pyramidal neuron and with different dynamics of Ca2+ front advancement. Note that the distance traveled by the leading edge of the Ca2+ front (shift) is notably shorter than in A.

