Fig. 8.
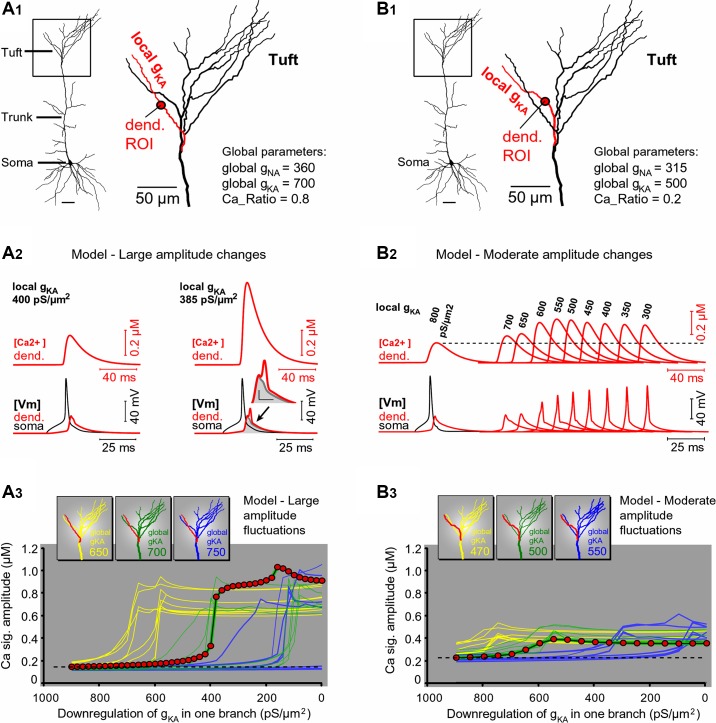
A-type current-mediated changes in apical tuft excitability: model. A1: a reconstructed PFC L5 pyramidal cell. Inset: on each model run, only one apical tuft branch will be altered (e.g., red). A2: dendritic intracellular Ca2+ concentration ([Ca2+]; red) and dendritic voltage (Vm; red) recorded from a location marked by red circle in A1. Somatic AP is black. A change in dendritic gKA from 400 (left) to 385 pS/μm2 (right) was made in one apical tuft branch. Dendritic voltage waveform is copied from that at left, colored gray, and superimposed at right. Arrow indicates broadening of voltage waveform at the base. Inset: blowup of voltage waveforms (scales, 10 mV and 5 ms). A3: peak amplitude of Ca2+ signal from each tuft dendrite plotted against gKA in that dendrite. Each color (yellow, green, and blue) represents uniform (global) gKA in the apical trunk and tuft (650, 700, and 750 pS/μm2, respectively). Red circles indicate data from the red branch in A1. Dashed horizontal line represents a baseline level of AP-Ca2+ signal associated with high levels of local gKA. B1 and B2: same as in A1 and A2, except global apical gNa, gKA, and gCa were reduced to mimic moderate amplitude changes. Local gKA was gradually changed from 800 to 300 pS/μm2 in the red dendrite only (local gKA values indicated above Ca2+ signals). B3: same organization of curves as in A3. Note that in this model, a relative increase in Ca2+ signal above baseline level (dashed horizontal line) is less pronounced than in A3, hence “moderate.”

