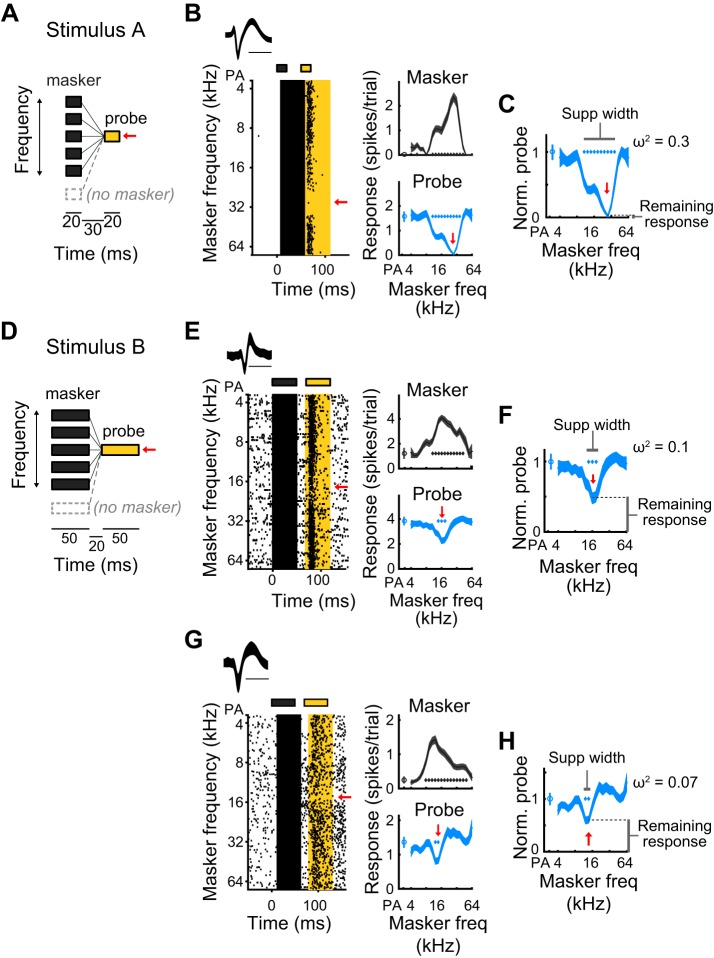
Fig. 1.
Measuring contextual interactions using a sequential forward suppression paradigm. A: forward suppression stimulus in which a masker tone, whose frequency varies from trial to trial, which precedes a probe tone, whose frequency (indicated by the red arrow) is constant. On randomly interleaved trials, called probe alone (PA) trials, the masker tone is omitted. Stimulus A is composed of 20-ms masker and probe tones, separated by a 30-ms gap. B: an example single unit’s response to stimulus A. Left: spike waveform (means ± SD of unit’s action potentials; scale bar is 1 ms). Raster shows spike times relative to the onset of the masker, as a function of masker frequency. Gray and yellow rectangles above raster signify times of masker and probe tones, respectively. Gray and yellow highlighted regions show the 50-ms time periods used to calculate average masker and probe responses, respectively. Red arrow, frequency of probe tone. Right, top: tuning profile (means ± SE of responses to the masker, as a function of masker frequency). Gray diamonds, masker frequencies for which responses significantly exceeded spontaneous. Right, bottom: suppression profile (means ± SE of responses to the probe, as a function of masker frequency). Blue diamonds, masker frequencies for which responses to the probe are significantly suppressed below the PA response. C: the normalized suppression profile, as a function of masker frequency, is produced by dividing the suppression profile by the probe alone response. Remaining response at probe frequency (lower vertical bar) is defined as the normalized probe response at probe frequency. Suppression width (horizontal bar) is measured as the range of masker stimuli, in octaves, that significantly suppress the probe response. Frequency dependence (ω2) is a measure of how strongly the response to the probe depends on the frequency of the masker tone (see materials and methods). D: stimulus B is similar to stimulus A, but composed of 50-ms masker and probe tones with a 20-ms gap between the two. E and F: as B and C. An example single unit’s response to stimulus B shows a relatively large remaining response at probe frequency, modest frequency dependence, and a narrow suppression width. G and H: as B and C. Another example single unit’s response to stimulus B, demonstrating that the highest normalized probe response can be >1 (i.e., the probe alone response).

