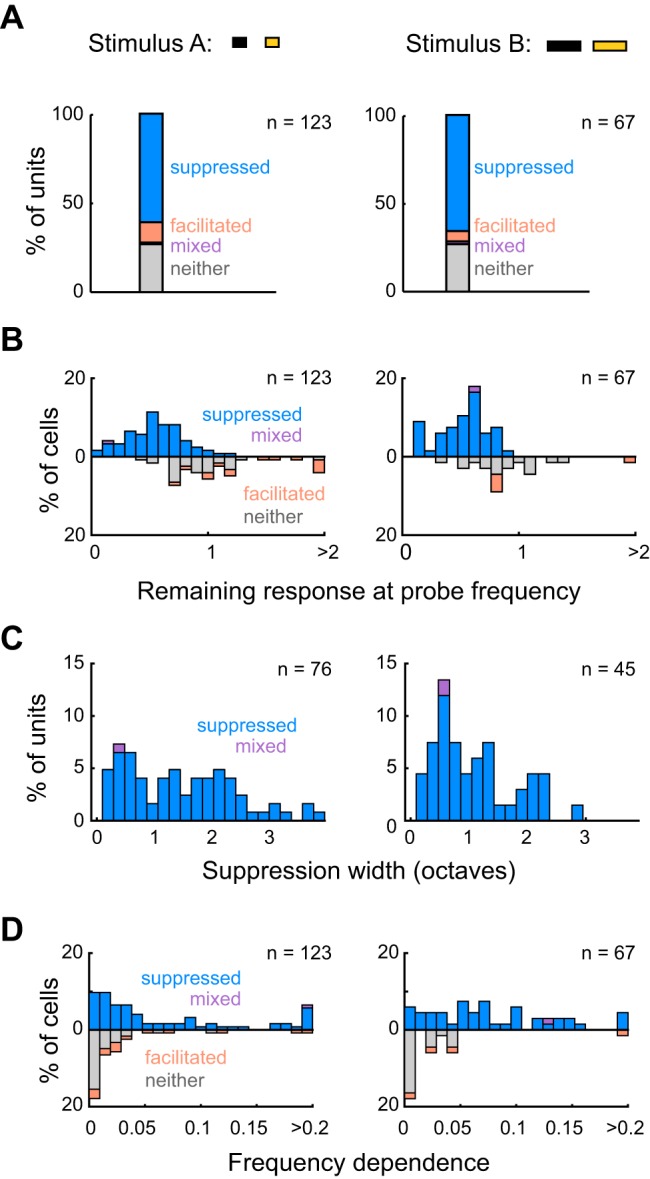
Fig. 3.

Forward suppression is similar between units presented with stimulus A (stim A) or stimulus B (stim B). A: percentages of all units presented with either stimulus A (left; n = 123) or stimulus B (right; n = 67) that were suppressed (stim A: 75 units; stim B: 44 units), facilitated (stim A: 14 units; stim B: 4 units), mixed (both suppressed and facilitated; stim A: 1 unit; stim B: 1 unit), or neither suppressed nor facilitated (stim A: 33 units; stim B: 14 units). These proportions are not different between stimulus A and stimulus B (Fisher’s exact test, P = 0.49). B: stacked distributions of remaining responses at probe frequency for units presented with stimulus A (left) or stimulus B (right). The remaining responses of all units are not significantly different between stimulus types (upward and downward bars; stim A: median remaining response = 0.7 ± 0.44; stim B: median remaining response = 0.61 ± 0.34; rank-sum, P = 0.11), nor are those among only suppressed/mixed units (upward bars; stim A: median remaining response = 0.54 ± 0.33; stim B: median remaining response = 0.55 ± 0.27; rank-sum, P = 0.91). C: stacked distributions of suppression widths for units with suppression widths >0 (i.e., suppressed/mixed units), presented with either stimulus A (left; n = 76) or stimulus B (right; n = 45). D: stacked distributions of frequency dependence for units presented with stimulus A (left) or stimulus B (right).
