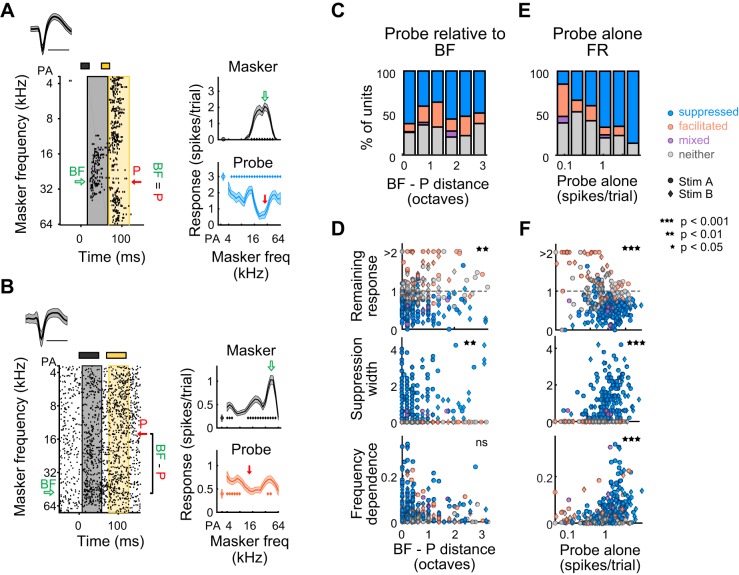
Fig. 7.
Quality of forward suppression depends on the spectral distance between probe tone and best frequency. A, left: raster of an example unit in which the probe (P) frequency (red arrow) is the same as best frequency (BF, green arrow). Right: In this unit, the response to the probe alone (PA) is relatively strong, and the probe response is broadly and deeply suppressed. B, left: raster of an example unit in which the probe frequency (red arrow) is 1.8 octaves from BF (green arrow). Right: in this unit, the response to the PA is relatively weak, and the probe response is facilitated. C: proportion of suppressed (blue), facilitated (orange), mixed (purple), and neither suppressed nor facilitated units (gray) as a function of BF – P distance. D: correlation of BF – P distance with remaining response at probe frequency (top), suppression width (middle), and frequency dependence (bottom). E: as C, as a function of the PA response. F: as D. Correlation of the PA response with remaining response at probe frequency (top), suppression width (middle), and frequency dependence (bottom).

