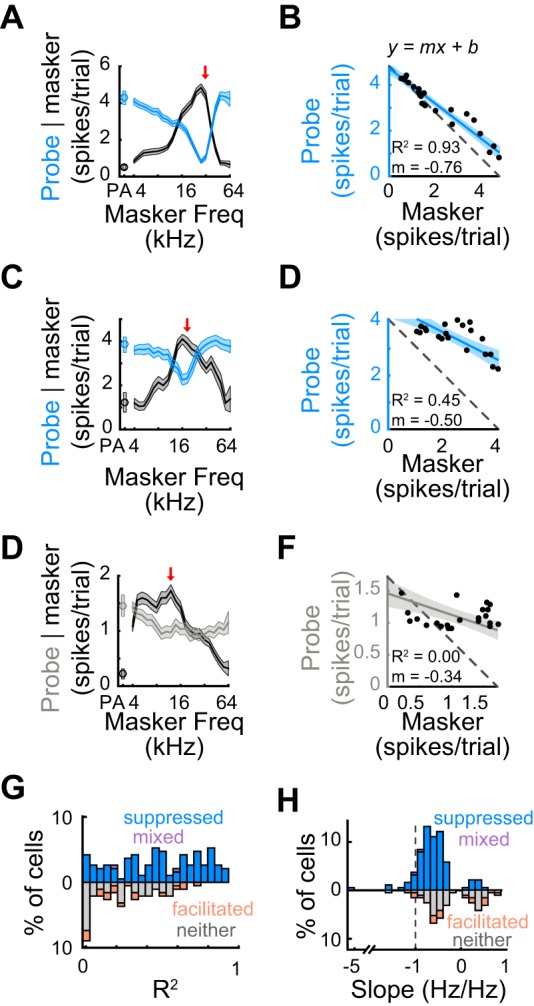
Fig. 9.

Probe responses often do not linearly relate to masker responses. A: means ± SE of response to the masker (black) and probe (blue) as a function of masker frequency for an example suppressed unit. Red arrow, probe frequency. B: linearly regressing the probe and masker responses reveals whether and to what extent the masker and probe responses are linearly related. In this example unit, an R2 of 0.93 indicates a good linear fit and a slope of −0.76 indicates that the range of probe responses was nearly that of the masker responses. C and D: as A and B. In this suppressed example unit, an R2 of 0.45 indicates a mediocre linear fit and a slope (m) of −0.50 indicates that the range of probe responses was half the range of masker responses. E and F: as A and B. In this example unit with no significant effect on the probe response, an R2 of 0 indicates a poor linear fit and a slope of −0.34 indicates that the range of probe responses was a third of the range of masker responses. G: distribution of R2 values for suppressed units (blue), facilitated units (orange), mixed units (purple), and units with no effect (gray). Most units do not exhibit high R2 values (all units, n = 190: median R2 = 0.41 ± 0.48; only suppressed/mixed units, n = 121: median R2 = 0.5 ± 0.46), indicating that the relationship between the probe responses and masker responses is more complex than a linear model would predict. H: as G, for the distribution of slope values. Median slope values >−1 (all units: median slope = −0.51 ± 0.41; only suppressed/mixed units: median slope = −0.59 ± 0.36) indicate that the probe responses of almost all units have a smaller range than masker responses.
