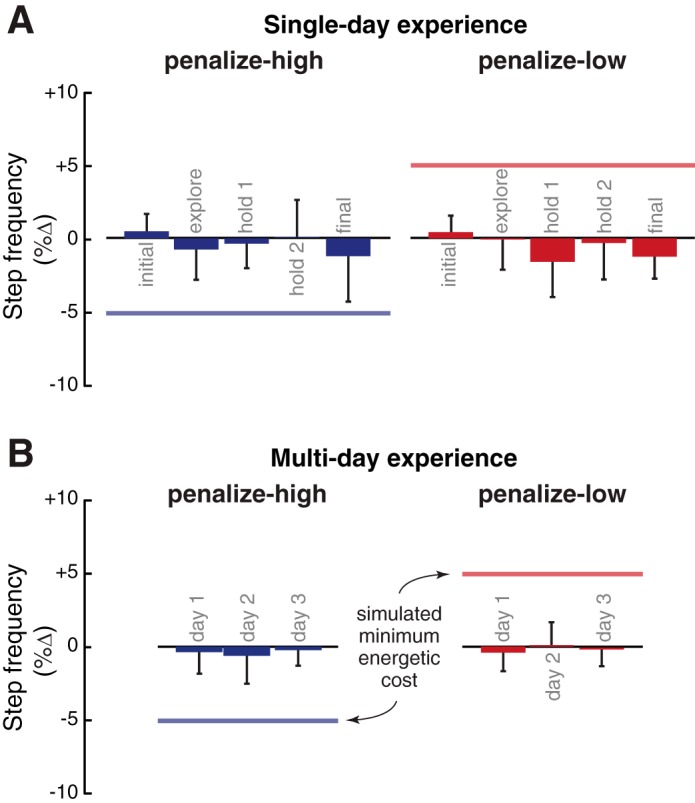
Fig. 4.

Adaptation results. A: preferred step frequency (%change from baseline preferred) across subjects at the 5 self-selected points throughout the adaptation protocol for experiment 1. These subjects each experienced both penalize-high (blue) and penalize-low (red) control functions on separate days. The colored horizontal line denotes the step frequency at which the simulated energetic cost was minimal. We observed no changes to preferred step frequency. B: group-averaged changes to preferred step frequency for experiment 2 subjects, who experienced a single control function over 3 days of repeated exposure. These subjects also did not demonstrate changes to preferred step frequency.
