
Figure 7.
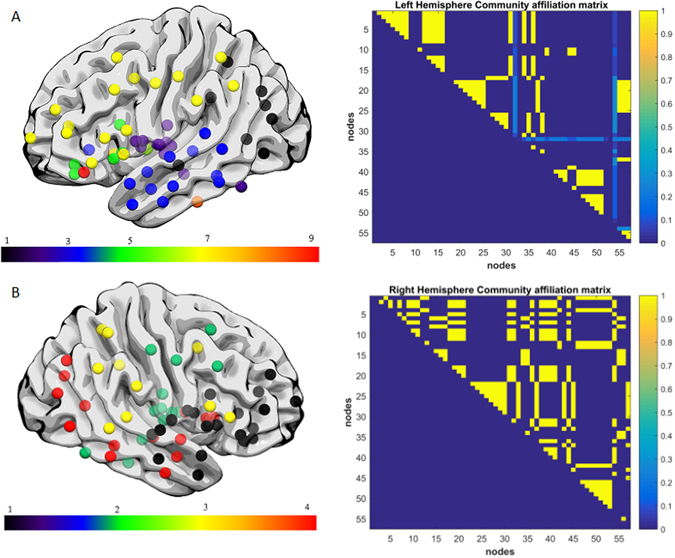
(A) Exemplar data Subject 3, each color represents a single community left hemisphere lateral view. There was marked fragmentation of the inferior frontal and middle-temporal networks with relative disconnection between the frontal and subcortical regions, with the left hemisphere grouping into 9 modules. Subject 3 had a lesion volume of 99.24 cm3, percent white matter damage of 0.096, and a WAB-AQ score of 58.2. There was unstable clustering and missing nodes in the community affiliation matrix compared to the right hemisphere matrix. (B) Exemplar data Subject 3, right hemisphere lateral view, each color represents a single community. There was no apparent fragmentation, and the network was divided into 4 communities. The community affiliation matrix showed relatively stable clustering over 100 runs.