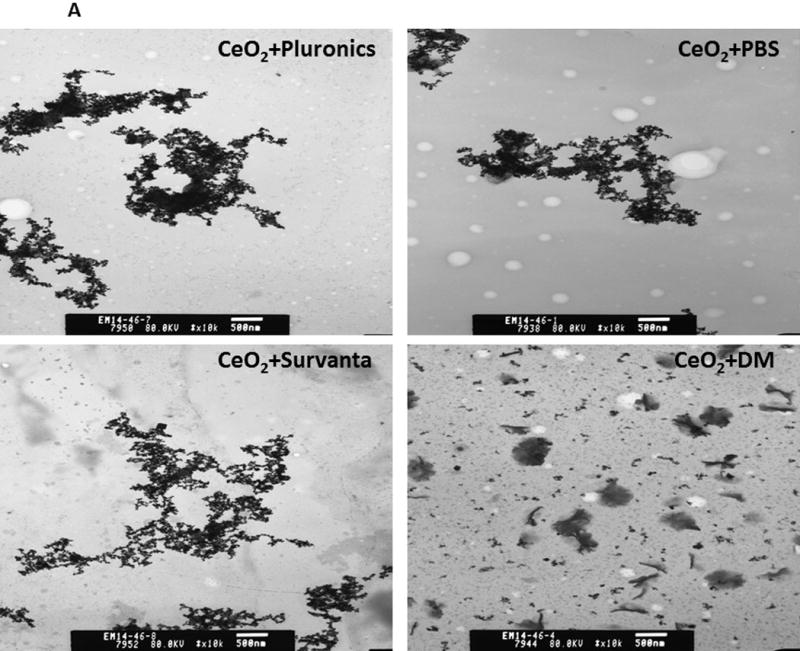
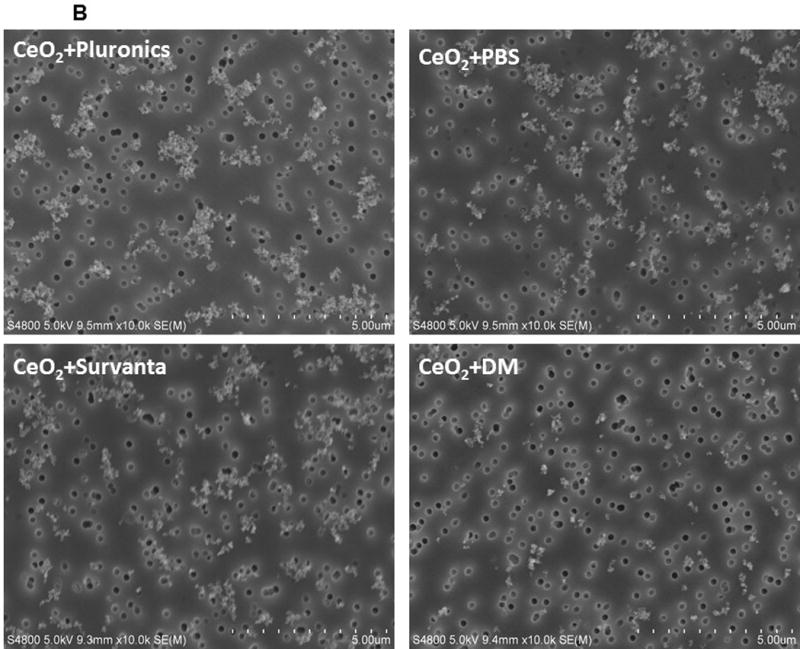
Figure 1.


Panel A. Transmission electron microscopy (TEM) micrographs of CeO2-NP in pluronic (after 20 min sonication, well-dispersed, Panel A), PBS (after 20 min of sonication, well-dispersed, Panel B), Survanta® (after 20 min sonication, Well-dispersed, Panel C), and DM (after 20 min sonication, Well-dispersed, Panel D). Samples for TEM analyses were obtained from the same samples used for dynamic light scattering analyses (data presented in Table 1). Panel B. Field emission scanning electron microscopic (FESEM) micrographs of CeO2-NP in pluronic (after 20 min sonication, well-dispersed, Panel A), PBS (after 20 min sonication, well-dispersed, Panel B), Survanta® (after 20 min sonication, well-dispersed, Panel C), and DM (after 20 min of sonication, well-dispersed, Panel D). Samples for FESEM analyses were obtained from the same samples used for dynamic light scattering analyses.
