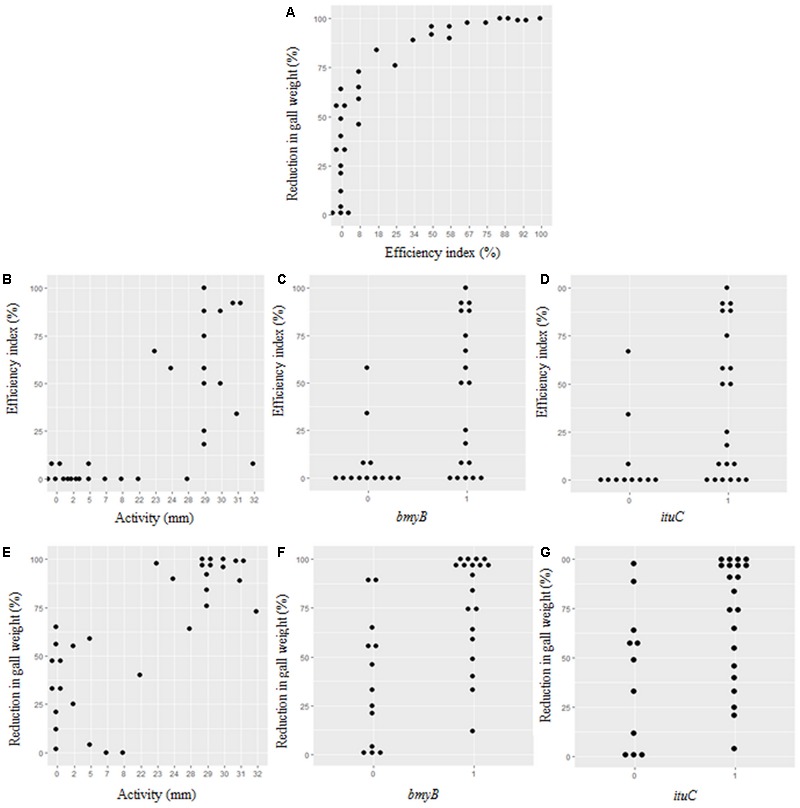
FIGURE 4.

Correlations between the antibacterial activity, the presence of the bmyB and the ituC genes, the biocontrol index and the disease reduction in gall weight. (A) Correlation between reduction in gall weight and efficiency index. (B–D) Correlations between efficiency index and activity, bmyB and ituC genes, respectively. (E–G) Correlations between reduction in gall weight and activity, bmyB and ituC genes, respectively.
