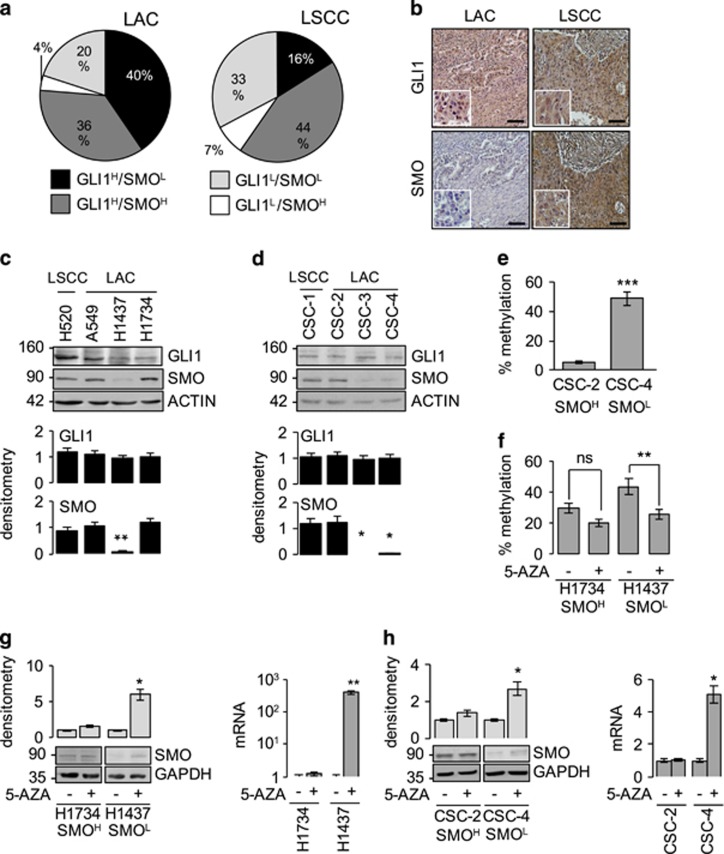
Figure 1.
HH–GLI pathway components in NCSLC. (a, b) IHC of SMO and GLI1 protein expression in human NSCLC tissue arrays (216 LACs, 291 LSCCs): (a) distribution of SMO/GLI1 phenotypes and (b) representative images of GLI1 and SMO staining. The LSCC sample in (b) is positive (H-score >50/300) for both proteins; the LAC displays only GLI1 positivity. Magnification × 20, inset × 40. Scale bar: 50 μm. (c, d) Western blots showing basal SMO and GLI1 protein expression in (c) commercial cell lines and (d) patient-derived CSCs from LSCC and LAC (see Supplementary Table S1 for cell genotypes). Bar graphs show densitometrically quantified band intensity values (n=3 or more) normalized to actin (loading control, LC). Asterisks show differences vs cell line with highest SMO expression. (e, f) Methylation levels in the proximal SMO regulatory region in (e) untreated LAC CSC lines and (f) commercial LAC cell lines before and after 5-AZA treatment. Cell lines are classified as SMOhigh (SMOH) or SMOlow (SMOL) based on findings shown in panels c and d. (g, h) Effect of 5-AZA-mediated demethylation on SMO expression (mRNA and protein) in (g) commercial LAC cell lines and (h) patient-derived LAC CSC lines. The mRNA level in each treated sample was calibrated against the corresponding basal level. LC: GAPDH. Bar graphs: densitometric analyses. *P<0.05; **P<0.01; ***P<0.001

