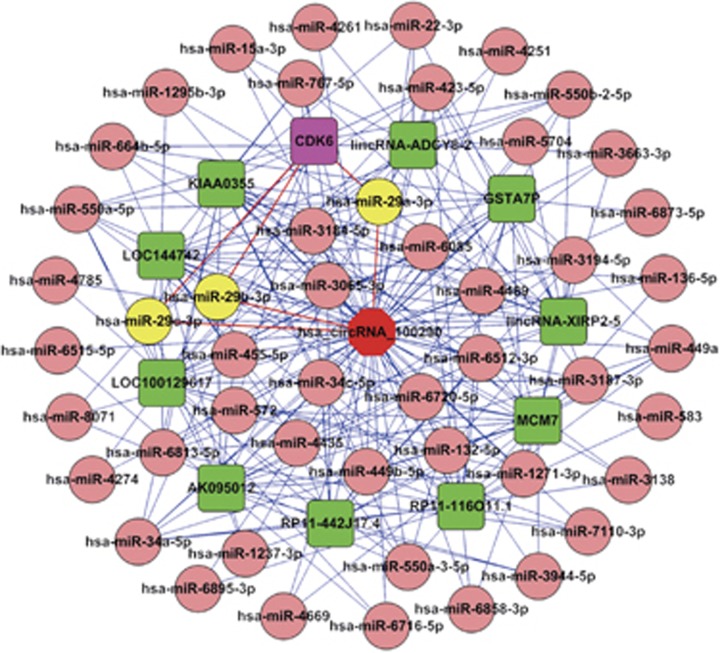
Figure 2.
ceRNA analysis for circRNA_100290. Cytoscape was used to visualize circRNA_100290-miRNA-target gene interactions based on the circRNA microarray and mRNA microarray data. In the network, 46 miRNAs that ranked relatively higher and 11 most possible target genes of these miRNAs were collected. The octagon represents circRNA_100290, the circle represents miRNAs and the round rectangle represents target genes of miRNAs (including mRNAs, lncRNAs and other transcripts). The relationship between the nodes was connected with solid lines. The enlarged and red marked solid lines show circRNA_100290-miR-29 family–CDK6 interactions.

