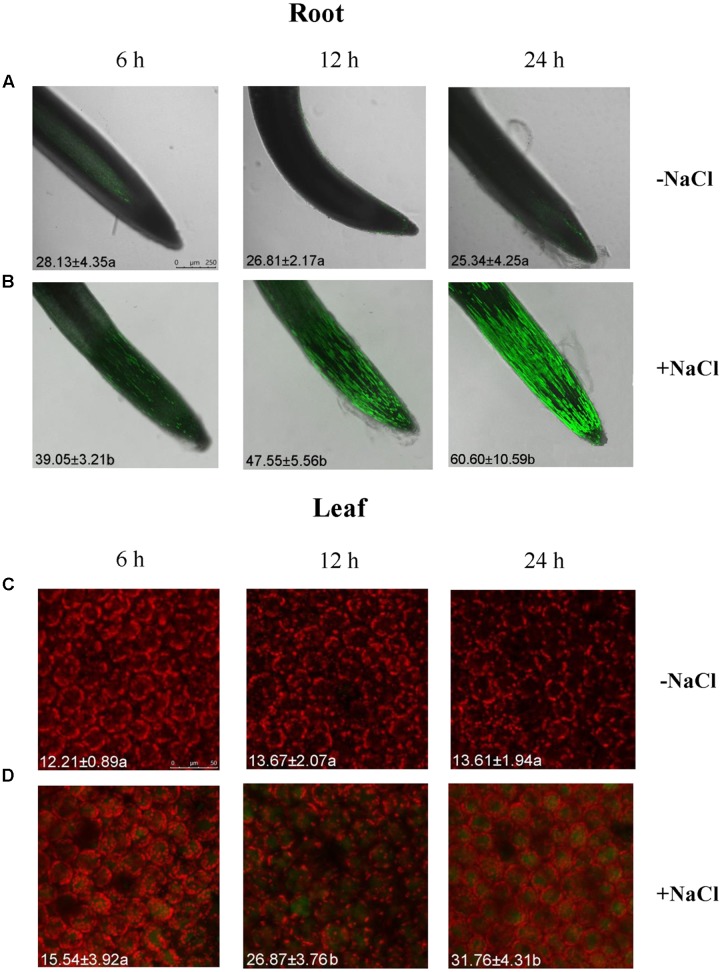
FIGURE 1.
Na+ concentrations in root and leaf cells of NaCl-stressed Glycyrrhiza uralensis. Two-week-old G. uralensis seedlings were exposed to 0 or 100 mM NaCl for 6, 12, and 24 h in one-quarter-strength Hoagland solution, then stained with CoroNa-Green AM to detect Na+ concentrations. Representative confocal images of (A,B) roots (scale bar: 250 μm) and (C,D) leaves (scale bar: 50 μm) show the Na+ content (bright green fluorescence). The orange-red color is chlorophyll autofluorescence. The mean value (±SD) of 4–5 independent experiments is shown in the left bottom corner of each panel, and different letters (a and b) denote significant differences (P < 0.05) between control (–NaCl) and salt treatment (+NaCl).

