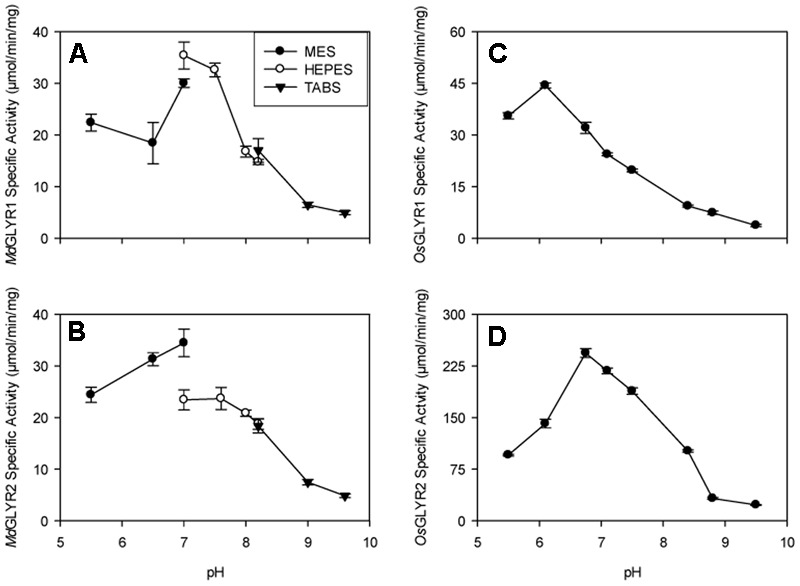
FIGURE 1.

Dependence of recombinant apple and rice GLYR activities on pH. The left and right panels, represent apple (A,B) and rice (C,D) GLYRs, respectively, whereas the upper and lower panels represent GLYR1s (A,C) and GLYR2s (B,D), respectively. The data, expressed as specific activity (μmol min-1 mg-1 protein), were determined using 50 μM glyoxylate and NADPH in thee buffers (50 mM each): 2-morpholino-ethanesulfonic acid, 4-(2-hydroxyethyl)-1-piperazineethanesulfonic acid and N-tris(hydroxymethyl)methyl-4-aminobutanesulfonic acid either separately (A,B) or together (C,D). Each datum represents the mean (±SD) of three technical measurements of a typical enzyme preparation.
