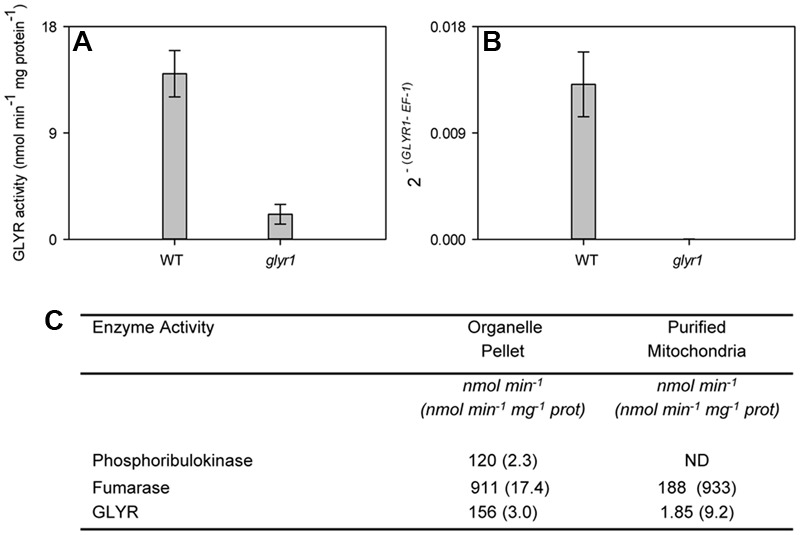
FIGURE 5.

Mitochondrial localization of GLYR2 activity in rosette leaf tissue from Arabidopsis. Total GLYR activity (A) and GLYR1 expression (B) in WT and glyr1 knockout mutant. Data represent the mean ± SE of three biological replicates. GLYR activity (total per fraction, or protein bases) in the organelle suspension and purified mitochondria from glyr1 mutant (C). Data represent a preparation of 50 g of rosette leaf tissue; ND, not detected. Similar results were obtained with a replicate preparation.
