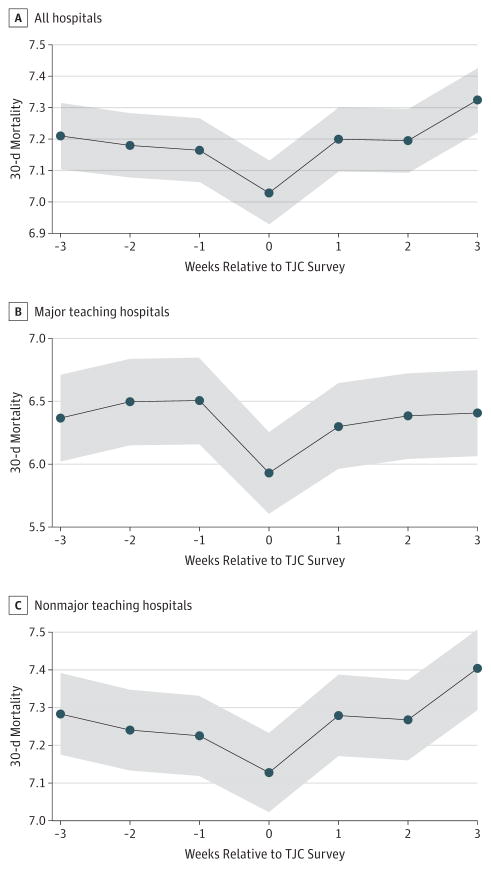
Figure 2. Unadjusted 30-Day Mortality by Week of Admission Relative to The Joint Commission Survey Visit.
Trends for 30-day mortality in week-long intervals relative to on-site surveys for all hospitals (A), major teaching hospitals alone (B), and nonmajor teaching hospitals (C). Shaded 95% CIs are shown for all unadjusted estimates, assuming a normal distribution of rates given the large sample size of admissions.

