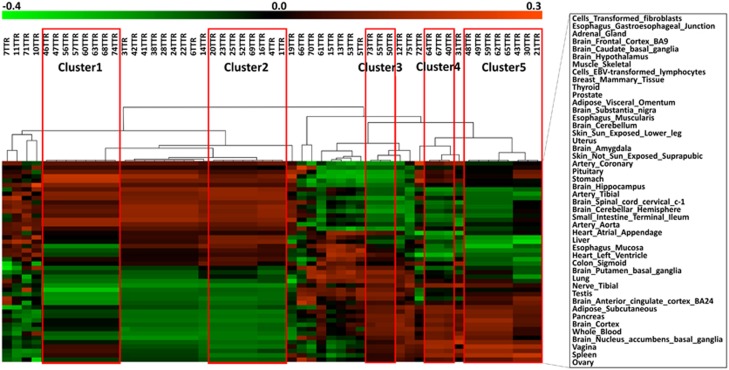
Figure 4.
Hierarchical clustering using tissue-specific polygenic score of the 55 patients re-sequenced. On the top the 55 patients and on the left the 46 considered tissues. Red boxes highlight the significant clusters (approximately unbiased P>95%). Red, green, and black colors correspond to genetically determined overexpression, under-expression, and little differential expression, respectively. The color scheme is also reported at the top of the figure. The full colour version of this figure is available at European Journal of Human Genetics online.

