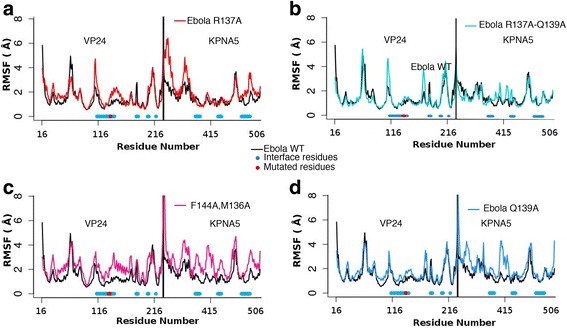
Fig. 2.

Root Mean Square Fluctuation (RMSF) for simulation of mutated Ebola virus VP24 with human Karyopherin RMSF for the mutants over the wild type complex. EBOV VP24 (on the left side of each graph) and KPNA5 (on the right) are shown. In black line the wild type complex RMSF is shown; in A), the red line shows R137A mutant, in B) the blue line shows the Q139A, in C) the magenta shows F134A-M136A mutant, in D) in cyan R137A-Q139A mutant are shown. In light blue the residues that are occurring at the interface are mapped under each curve
