
Fig. 3.
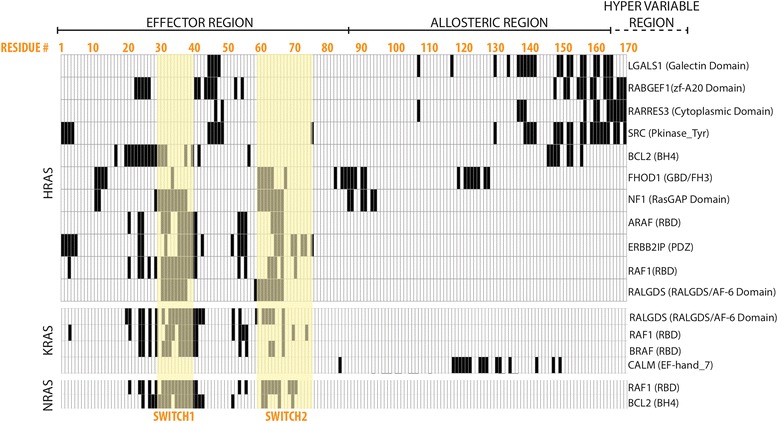
A map of the RAS amino acid residues predicted to mediate physical interactions with RAS binding partners. HRAS, KRAS and NRAS are each depicted by separate matrices. Each row corresponds to a binding partner, and each column corresponds to an amino acid position on a RAS protein. If a residue is involved in a specific PPI, the corresponding cell is painted in black. Amino acid residue position numbers are displayed in orange at the top of the figure. The residues comprising the effector, allosteric and hypervariable regions are labeled. The residues in the switch regions are highlighted in yellow. The domain on the interaction partner that is predicted to interact with RAS is listed in parentheses next to the binding partner’s name