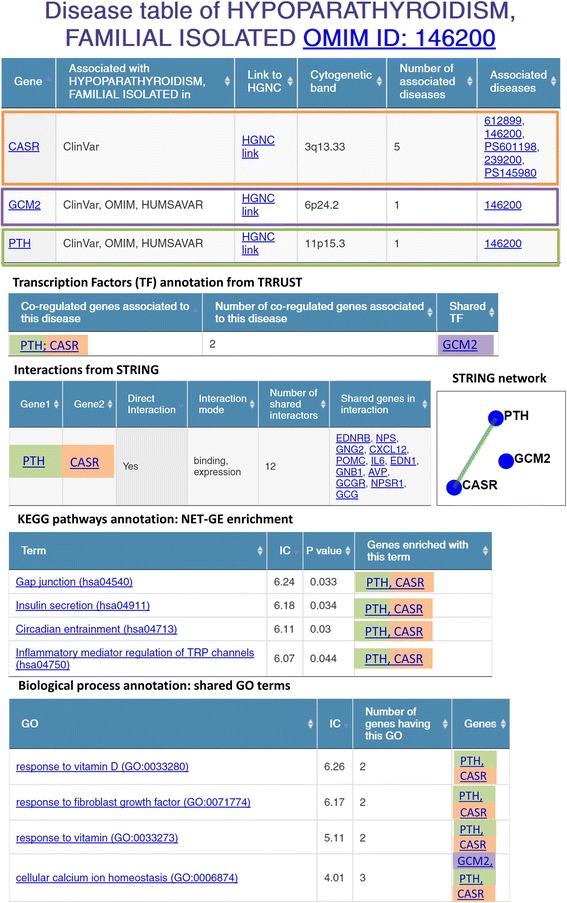
Fig. 3.

eDGAR page for hypoparathyroidism (OMIM 146200). In the figure, each gene is highlighted with a different color; the Transcription Factor annotation and the known interactions are reported, together with the simple graph describing them. A summary of the KEGG pathways enriched with NET-GE and the shared GO terms for BP is also provided
