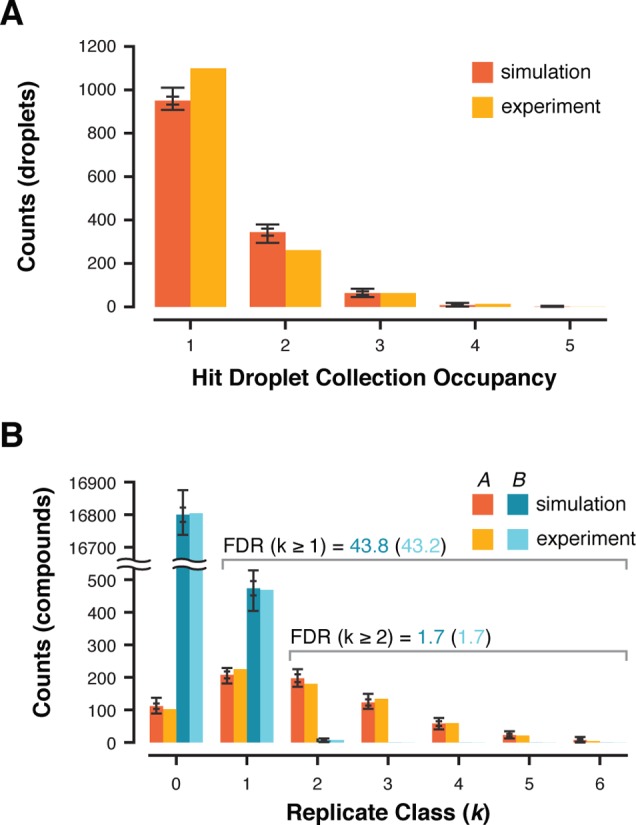
Figure 3.

Comparison of simulation results and experimental data. Experimentally derived parameters were used for 100 simulations. (A) Hit collection droplet occupancy for the experiment is plotted and compared to simulation average (λdrop = 0.37). (B) Positive A compounds and negative B compounds identified in the hit collection were distributed into replicate k classes and compared to the simulation distribution of A and B elements. The cumulative false discovery rate (FDR) for all hit collection elements in k ≥ 1 class and k ≥ 2 class as observed experimentally and by simulation are displayed above the chart. Standard deviation and value range are displayed as nested error bars for all simulation data.
