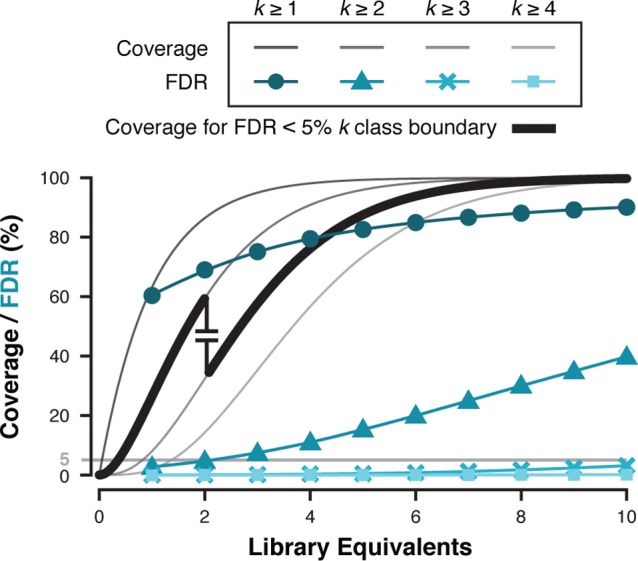
Figure 4.

Library coverage as a function of FDR and library equivalents (ε) screened. Screening simulations were run for a 100k-member library with a 1.5% hit rate. Screening aliquot sizes ranged from 1−10 library equivalents (100 simulations). Library coverage curves for each cumulative replicate class (k ≥ 1–5, gray) are based on a Poisson cumulative distribution function. FDR (%) was plotted as a function of ε for each cumulative replicate class (k ≥ 1–4, teal). Coverage (bold trace) constrained by FDR (<5%, gray horizontal) is calculated for each simulation iteration and the average is plotted (standard deviation markers are smaller than the data points). Simulation results are shown for average droplet occupancy λdrop = 1.
