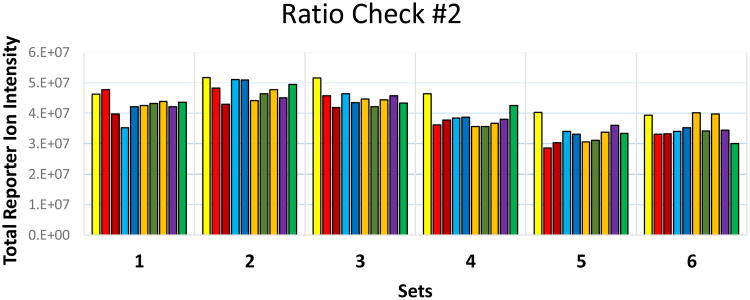
Figure 2.
Results of the second pilot ratio check for a study involving six TMT10plex experimental sets. The total intensity of each reporter ion channel is shown after 1 to 5 μL of each differentially tagged sample were combined and analyzed in a single LC- MS/MS run. The volumes combined were adjusted based upon the data in Figure 1. Reporter ions are color-coded from lowest (yellow=126 Da) to highest mass from left to right respectively for each experimental set.

