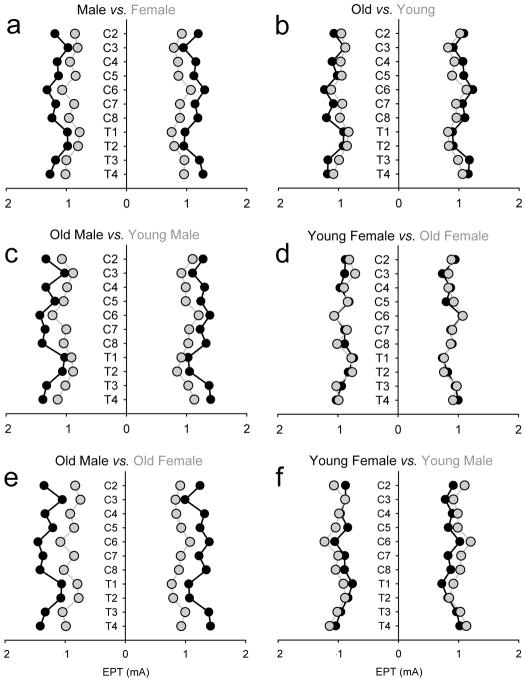
Figure 2. EPT – healthy controls.
EPT results plotted by gender (male, black circles vs. female, gray circles; A) and age (young, ≤ 50 years old, gray circles vs. old, ≥ 50 years old, black circles; B) in all healthy controls tested. Data for old and young males (black and gray circles; C), old and young females (gray and black circles; D), old male and females (black and gray circles; E), and young male and females (gray and black circles; F) is also presented. The x-axis shows that stimulus intensity (mA) used during testing and the y-axis shows the dermatomes tested. Note that overall older male show higher EPT values.

