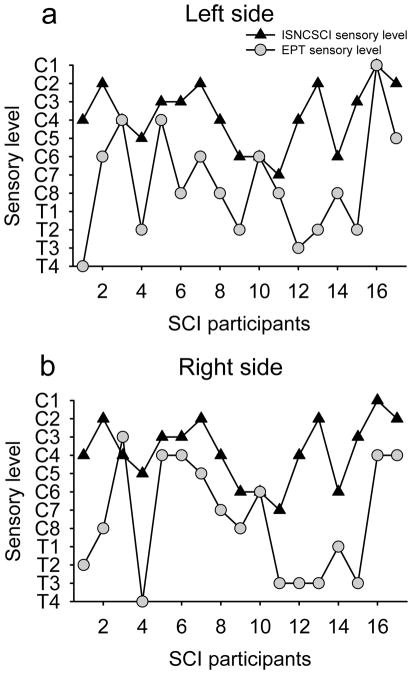
Figure 5. EPT vs ISNCSCI in SCI participants.
In the graphs, the abscissa shows the SCI participants tested and the ordinate shows the sensory level detected by the EPT (gray circles) and ISNCSCI (black triangles) exams in the left (A) and right (B) side of the body. Note that regardless of the side tested the sensory level detected by the EPT was below the sensory level detected by the ISNCSCI exam in the majority of SCI participants.

