Abstract
The auditory ascending system contains parallel pathways in vertebrate brains. In chickens (Gallus gallus), three pathways arise from nucleus laminaris (NL), nucleus angularis (NA), and regio intermedius (RI) in the brainstem, innervating three subdivisions of the nucleus mesencephalicus lateralis pars dorsalis (MLd) in the midbrain. The current study reveals the segregation of these pathways in their subsequent projections to the nucleus ovoidalis (Ov) in the thalamus. Based on cytoarchitecture and myelin distribution, we identified seven Ov subregions, including five neuronal clusters within the Ov proper, the nucleus semilunaris parovoidalis (SPO), and the circum-ovoidalis (cOv). Immunocytochemistry further revealed that a ventromedial cluster of the Ov proper (Ovvm) contains unique cell types expressing α8 subunit nicotinic acetylcholine receptor, while SPO and cOv are characterized with expression of calcitonin-gene-related peptide and cholecystokinin. Tract tracing studies demonstrated that Ovvm is a major target of the NL-recipient zone of MLd, while the RI-recipient zone of MLd predominantly projects to a ventrolateral cluster of the Ov proper. Afferent inputs to the remaining regions of the Ov proper mostly arise from the NA-recipient zone of MLd. SPO and cOv receive a projection from the surrounding areas of MLd, named the nucleus intercollicularis. Importantly, the Ov proper, SPO and cOv all project to the Field L2 in the forebrain, the avian auditory cortex. Taken together, these results demonstrate that the avian auditory thalamus is a structurally and functionally heterogeneous structure, implicating an important role in generating novel representations for specific acoustic features.
Keywords: nucleus ovoidalis, nucleus mesencephalicus lateralis pars dorsalis, inferior colliculus, medial geniculate nucleus, auditory ascending pathway, sensory information processing, RRID:AB_880202, RRID:AB_2313804, RRID_AB258806, RRID: AB_1078377
Introduction
Birds have been used successfully as a suitable model for studying auditory information processing as well as vocal recognition and discrimination (Prather, 2013; Ohmori, 2014; Carr et al., 2015). As in mammals, the avian thalamus is the major source of ascending auditory information to the cortex (Karten, 1968; Häusler, 1988; Brauth and Reiner, 1991; Wild et al., 1993; Vates et al., 1996; Mello et al., 1998). In contrast to extensive studies at the brainstem and midbrain levels, the organization and function of the avian auditory thalamus have not been studied systematically. How acoustic signals are processed and integrated in the thalamus is largely unknown, although novel representations for specific acoustic features are generated at this level in zebra finches (Amin et al., 2010).
The auditory ascending projection contains multiple information pathways at the brainstem and midbrain levels. In barn owls, chickens, and pigeons, two pathways from the nucleus laminaris (NL) and nucleus angularis (NA) in the brainstem project upon distinct subregions of the nucleus mesencephalicus lateralis pars dorsalis (MLd; also called the inferior colliculus) on the contralateral side of the brain (Leibler, 1975; Conlee and Parks, 1986; Takahashi and Konishi, 1988; Wild, 1995; Wang and Karten, 2010). These two pathways process time and intensity information, respectively, in barn owls (Moiseff and Konishi, 1983; Sullivan and Konishi, 1984; Takahashi et al., 1984). In addition, a third pathway has been identified in chickens, constituting a bilateral projection to a discrete region of the MLd from the regio intermedius (RI), an interposed region of cells lying between NL and NA (Wang and Karten, 2010). This pathway targets MLd neurons sensitive to signals of very low frequencies (Theurich et al., 1984).
To explore how specific auditory features are processed and integrated for recognizing complex natural sounds, it is essential to understand how these pathways are organized in their subsequent projections to the thalamus and eventually to the forebrain. Such information, however, is missing, largely due to limited understanding of the internal organization and connectivity of the auditory thalamus. In birds, the auditory thalamus includes the nucleus ovoidalis (Ov) as well as the surrounding auditory areas. Anatomically, it has long been recognized that the proper body of the Ov is heterogeneous in the general cytoarchitecture (Leibler, 1975; Häusler, 1988; Wild et al., 1993). In pigeons, budgerigars and zebra finches, axons arising from various MLd subregions appear to terminate in restricted regions of the Ov proper (Leibler, 1975; Brauth et al., 1987; Fortune and Margoliash, 1991; Durand et al., 1992; Vates et al., 1996). Studies in the pigeon further reported that the Ov tends to form distinct clusters that project to different areas of the Field L2a (Wild et al., 1993), the avian homologue layer IV of the mammalian primary auditory cortex (Wang et al., 2010). Physiologically, although only one tonotopic map is identified within the Ov (Bigalke-Kunz et al., 1987; Häusler, 1988; Proctor and Konishi, 1997), cells with best frequencies that differed greatly from their neighbors were recorded in starlings (Häusler, 1988; Diekamp and Margoliash, 1991). In addition, cells with multiple peaks in their best frequency-tuning curve were found in barn owls (Proctor and Konishi, 1997), supporting the heterogeneity of the Ov proper in organization and in their afferent inputs.
The complexity of the auditory thalamus is further reiterated when a number of thalamic cell groups adjacent to the Ov proper were considered as additional components of the auditory thalamus. These cell groups appear to receive auditory inputs from neurons within or adjacent to MLd (Karten, 1967; Häusler, 1988; Durand et al., 1992; Wild et al., 1993; Metzger et al., 1998; Zeng et al., 2004). In particular, a prominent nucleus semilunaris parovoidalis (SPO) was identified in several avian species, located immediately ventral to the Ov proper. SPO receives auditory input from the midbrain and the brainstem nucleus of the lateral lemniscus (Karten, 1967; Wild, 1987), and in turn projects upon the Field L2b in the forebrain (Wild et al., 1993). How SPO and other identified thalamic cell groups contribute to the auditory ascending system remain to be determined.
We examine the organization and connectivity of the auditory thalamus in chickens, with a focus on the internal structure of the Ov proper. Our data demonstrate that the Ov proper is heterogeneously organized in a way that the three ascending pathways arising from the brainstem and midbrain remain largely segregated in their subsequent projection upon the thalamus. We also identify SPO and the circum-ovoidalis (cOv) as additional components of the auditory thalamus contributing to the primary auditory ascending system. This study describes the cyto- and chmo-architecture of the Ov as well as the topography of its afferent inputs from MLd. A subsequent manuscript will describe the projection arising from the brainstem nucleus of the lateral lemniscus upon both MLd and Ov, additional pathways in the ascending auditory system.
Materials and Methods
This study was performed on White Leghorn chick hatchlings of less than ten days age (Gallus gallus). All procedures were approved by the Florida State University and University of California at San Diego Institutional Animal Care and Use Committees, and carried out in accordance with the National Institutes of Health Guide for the Care and Use of Laboratory Animals.
Histology and Immunocytochemistry
Fourteen (14) chicks were anesthetized with a mixture of 40 mg/kg ketamine and 12 mg/kg xylazine and transcardially perfused with 0.9% saline followed by chilled 4% paraformaldehyde (or 2% for immunocytochemistry for anti-α8 AChR) in phosphate buffer (PB; 7.2–7.4 pH). The brains were removed from the skull, postfixed overnight in 4% paraformaldehyde solution, and then transferred to 30% sucrose in PB until they sank. Each brain was frozen and cut either coronally or sagittally at 30 μm on a freezing sliding microtome. Sections were collected in phosphate-buffered saline (PBS; 7.2–7.4 pH) into four alternate series. Each series was stained for Nissl substance, acetylcholinesterase, myelin or for immunocytochemistry.
Acetylcholinesterase activity was labeled according to the procedure of Katz and Karten (1983). Sections were incubated in a solution consisting of 4 mM acetylthiocholine (Kodak), 10 mM glycine, 2 mM cupric sulfate, and 50 mM sodium acetate in distilled water (titrated to pH 5.0 with drops of glacial acetic acid) in the dark overnight at room temperature. Sections were then treated with 1% ammonium sulfide for 2 minutes. After washes in distilled water, sections were transferred to a gelatin-alcohol solution (0.5% gelatin in 40% alcohol), and mounted onto gelatin-subbed slides. Sections were then air-dried, cleared in xylene and coverslipped with Permount (Fisher; Pittsburgh, PA).).
Myelin stain was performed according to the procedure of Gallyas (1979). Mounted sections were fixed in 2:1 pyridine/acetic anhydride for one hour and then rehydrated for 3 min in 50% ethanol, 3 min in 25% ethanol, 3 min in 0.05% aqueous acetic acid, 3 min in 0.1% acetic acid, and then 10 min in 0.5% acetic acid. Sections were then incubated for one hour in a fresh silver nitrate solution (0.3% ammonium nitrate, 0.3% silver nitrate, 0.04% sodium hydroxide), washed in 0.5% acetic acid and placed in a developer solution (2.5% anhydrous sodium carbonate, 0.1% ammonium nitrate, 0.1% silver nitrate, 0.5% tungstosilicic acid, 0.06% paraformaldehyde). When sections reached a desired staining intensity, they were washed for 5 minutes each in 0.5% acetic acid, 0.2% potassium ferricyanide, ddH2O, and 0.5% sodium thiosulfate. When appropriate, Nissl stain was performed before sections were dehydrated in ethanol, cleared in xylene and coverslipped with Permount.
For immunocytochemistry, sections were incubated with primary antibody solution diluted in PBS with 0.3% Triton X-100 overnight at 4°C, followed by biotinylated IgG antibodies (1:200, Vector Laboratories, Burlingame, CA) for an hour at room temperature. Sections were then incubated in avidin-biotin-peroxidase complex solution (ABC Elite kit; Vector Laboratories, Burlingame, CA) diluted 1:100 in PBS with 0.3% Triton X-100 for an hour at room temperature. Sections were incubated for 3–5 minutes in 0.025% 3-3′-diaminobenzidine (Sigma) with 0.01% hydrogen peroxide in PB. Sections were mounted on gelatin-coated slides and were stained with 0.05% osmium tetroxide for 30 seconds. Sections were then dehydrated, cleared, and coverslipped. For fluorescent immunostaining, after primary antibody incubation, sections were incubated with fluorescent secondary antibodies, Alexa 488 goat anti-mouse and Alexa 568 goat anti-rabbit (1:200; Molecular Probes, Eugene, OR) for 2–4 hours at room temperature. Fluorescently labeled sections were then coverslipped with Fluoromount-G® (SouthernBiotech, Birmingham, AL).
Antibody Characterization
Five primary antibodies were used for immunocytochemistry. The optimal antibody concentration was obtained by running a series of concentration tests to avoid floor or ceiling truncation, including a negative control by omitting primary antibody. Immunogen, host species, clone type, manufacturer’s information, as well as dilution used for each antibody, are listed in Table 1.
Table 1.
Primary antibodies used for immunocytochemistry. Abbreviations: see table of abbreviations.
| Antigen | Manufacturer, catalog number, Host, monoclonal or polyclonal; RRID | Concentration | |
|---|---|---|---|
| GFAP | synthetic peptide corresponding to C terminal amino acids 417–430 of human GFAP: DGEVIKESKQEHKD | Abcam (Cambridge, MA), ab53554; Goat
polyclonal RRID: AB_880202 |
1:1000 |
| parvalbumin | purified frog muscle parvalbumin: MAFAGVLNDADITAALEACKAADSFNHKTFFAKVGLTSKSADDVKKAFAIIDQDKSGFIEEDELKLFLQNFKAGARALTDGETKTFLKAGDSDGDGKIGVDEFTALVKA | Sigma (St. Louis, MO), P3171 Mouse monoclonal RRID: AB_2313693 |
1:10,000 |
| CCK | synthetic sulfated CCK (26–33) amide (sulfated CCK-8): DPAGSGL | Sigma, C2581; Rabbit, polyclonal RRID: AB_258806 |
1:5000 |
| CGRP | a synthetic fragment of C-terminal rat CGRP: AQKRSCNTATCVTHRLAGLLSRSGGVVKDNFVPTNVGSEAFGRRRRDLQA | Sigma, C9487; Mouse monoclonal RRID: AB_1078377 |
1:1000 |
| α8 nAChR | affinity-purified α8 from chick brain | Donated by Dr. Jon Lindstrom (The Salk Institute for Biological Studies, San Diego, CA)Rat monoclonal | 1:1000 |
Goat anti-glial fibrillary acidic protein (GFAP) was purchased from Abcam (Cambridge, MA; ab53554). The immunogen was a synthetic peptide corresponding to C terminal amino acids of human GFAP. The antibody was purified from goat serum by ammonium sulphate precipitation followed by antigen affinity chromatography using the immunizing purified antigen. Anti-GFAP specifically recognizes human, mouse, and gerbil GFAP in brain lysate and tissues. The specificity of the antibody on chicken brain tissue was further characterized by Western blot in the current study (Fig. 1).
Figure 1.
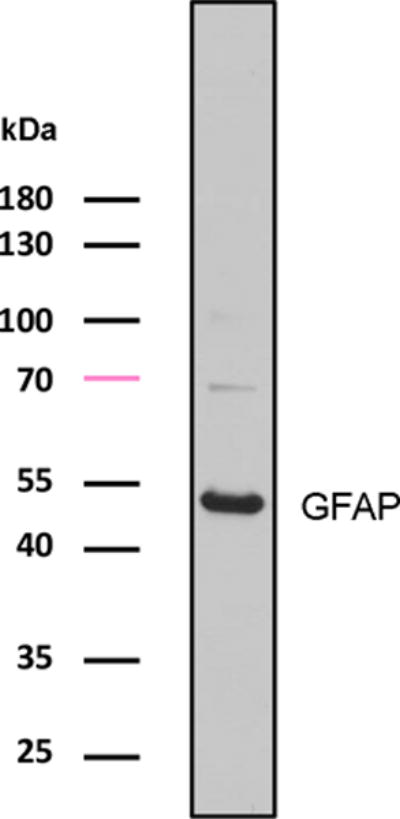
Antibody characterization for anti-GFAP in the chicken brain by Western blot. 50 μg of protein was loaded. Molecular weight standards (left) were used to determine relative protein sizes. Abbreviations: see table of abbreviations for this and all subsequent figures.
Monoclonal anti-parvalbumin antibody was purchased from Sigma (St. Louis, MO; P3088), derived from the PARV-19 hybridoma produced by the fusion of mouse myeloma cells and splenocytes from an immunized mouse. Purified carp muscle parvalbumin was used as the immunogen. Anti-parvalbumin reacts specifically with parvalbumin of cultured nerve cells and tissue, and specifically stains the 45Ca-binding spot of parvalbumin (12K molecular weight by immunobinding). Based on the datasheets provided by Sigma, the anti-parvalbumin “does not react with other members of the EF-hand family such as calmodulin, intestinal calcium-binding protein, S100A2 (S100L), S100A6 (calcyclin), the α chain of S-100 (i.e. in S-100a and S-100ao), or the β chain (i.e. in S-100a and S-100b)”. In the current study, immunohistochemistry for this antibody reveals comparable staining patterns of parvalbumin in the chick brain as previously reported (Pfeiffer and Britto, 1997; Panicker et al., 2002; Wang et al., 2006).
Polyclonal anti-cholecystokinin (CCK) made in rabbit was purchased from Sigma (C2581). The immunogen was synthetic sulfated CCK (26–33) amide (sulfated CCK-8), conjugated to KLH. Sulfated CCK (26–33) amide is the major and the most potent CCK form in the brain and periphery. This antibody, as tested in human tissue, binds to sulfated and unsulfated CCK-8 and shows cross reactivity with caerulein. In the current study, immunohistochemistry for this antibody reveals comparable staining patterns of CCK in the chick brain as previously reported (Shimizu and Karten, 1990; Erichsen et al., 1991; Güntürkün and Karten, 1991).
Monoclonal anti-calcitonin-gene-related peptide (CGRP), purchased from Sigma (C9487), was generated from the hybridoma CD8 produced by mice using as immunogen a synthetic fragment of C-terminal rat α-CGRP glutaraldehyde conjugated to bovine serum albumin. The specificity of the antiserum for its antigen was tested by homologous control experiments (Berk et al., 1993) and has also been demonstrated in the mammalian brain by Torrealba (1992). The sequence of CGRP is highly conserved across human, rat, and chicken. In the current study, immunohistochemistry for this antibody reveals comparable staining patterns of CGRP in avian brains with other anti-CGRP antibodies (Brauth and Reiner, 1991; Lanuza et al., 2000).
Localization of α8 subunit nicotinic acetylcholine receptor (nAChR) was identified by a monoclonal antibody 305 kindly donated by Dr. Jon Lindstrom. The 305 antiserum was produced in rat using affinity-purified α8 immunogen from chick brain (Schoepfer et al., 1990; Whiting et al., 1987, 1991). Western blot analysis showed that antibody 305 bound α-bungarotoxin binding protein α2 subtypes of native chicken tissue (Schoepfer et al., 1990). This antibody has been used for localizing α8 subunit nAChR in the chicken brain and retina (Britto et al., 1992, 1994; Keyser et al., 1993). The current study examined the same tissue sections as reported in these previous studies.
Western blot
Protein samples were harvested from flash frozen chicken brainstem tissue. Samples were homogenized in EDTA buffer (62.5 mM Tris-HCl pH 6.8, 2% SDS, 10% Glycerol, 5% β-ME, 10 mM EDTA) using the Ultra-Turrax® T10 homogenizer (IKA® Works, Inc., Wilmington, NC). 50 μg of protein lysate in SDS buffer (2% SDS, 50 mM Tris pH 7.6, 5% glycerol, and 0.025% bromophenol blue) was incubated at 70°C for 10 minutes, resolved in NuPAGE 4–12% Bis-Tris Gels (Life Technologies, Carlsbad, CA), and then transferred onto PDVF membranes (GE Healthcare, Chicago, IL). After blocking in 5% milk in PBS with 0.05% Tween (PBS-T) for 30 minutes at room temperature, membranes were probed against the goat anti-GFAP antibody overnight at 4°C in 1% milk in PBS-T. Specific secondary HRP-conjugated antibodies were used at 1:2500 dilution (Santa Cruz, Biotechonology®, Inc., Dallas, TX) and blots were developed with SuperSignal™ West Pico Chemiluminescent Substrate (Thermo Scientific, Inc., Waltham, MA) and exposed to X-ray film.
Cholera toxin B subunit tracing study
Thirty-eight (38) chicks were anesthetized as described above and placed in a stereotaxic head holder. The skull was exposed and a hole was made above the injection target area estimated from stereotaxic coordinates. A solution of 1% cholera toxin B subunit (CTB; List Laboratories, Campbell, CA) in PB was injected through a glass micropipette using a pressure device (PicoSpritzer II; General Valve, Fairfield, NJ). The micropipette was retracted, the wound was closed and the animal was allowed to recover. The injection sites are listed in Table 2.
Table 2.
Injection sites in the midbrain and forebrain.
| Case | Injection site |
|---|---|
| 466, 480, 481, 483, 484 | NA |
| 461, 468, 469, 471, 472, 477 | NM/NL |
| 419, 327, 339 | caudal MLd |
| 322, 323, 324 | ventral MLd |
| 333, 338, 340 | dorsal MLd |
| 319 | central MLd |
| 418 | rostromedial MLd |
| 337, 340, 343, 417 | ICo |
| 435, 454, 455, 477, 478, 479, | Ov/SPO |
| 523, 524, 525, 526, 527 | Field L |
| 508 | Nucleus Taenia |
After a survival time of 3–5 days, animals were anesthetized and perfused with paraformaldehyde solution. The brains were removed from the skull, postfixed, equilibrated in sucrose and sectioned at 30μm in the coronal plane. Sections were incubated with antibodies against CTB made in goat (1:12,000, List laboratories), followed by biotinylated anti-goat IgG antibodies (1:200, Vector Laboratories, Burlingame, CA). Avidin-biotin-peroxidase complex solution and 3-3′-diaminobenzidine were used as the final steps in visualization of CTB. Sections were mounted on gelatin-coated slides and were either stained with 0.05% osmium tetroxide for 30 seconds or counterstained with Giemsa (Iñiguez et al., 1985). Sections were then dehydrated, cleared, and coverslipped. For double labeling of CTB tracing and immunocytochemistry for CCK, after primary antibody incubation, sections were incubated with fluorescent secondary antibodies, Alexa 488 donkey anti-goat and Alexa 568 donkey anti-rabbit (1:200; Molecular Probes, Eugene, OR) for 2–4 hours at room temperature. Fluorescently labeled sections were then coverslipped with Fluoromount-G®.
In two additional animals, a large amount of CTB was placed into the tectum with substantial leakage into the ventricle. In both cases, no labeled terminal was found in any subdivisions of the Ov complex, indicating that detected anterograde labeling in the Ov following injections into MLd and ICo were not the result of CTB leaking into the tectum and ventricle along the path of electrode penetrations.
Data analyses
To compare neuronal cell size between Ov subdivisions, we measured cross-sectional somatic area and cell diameter in Nissl-stained sections in the coronal plane. Three animals were used for this analysis. For each animal, one section was chosen from the rostral Ov at the level comparable to Fig. 2A6 for sampling SPO, and another section from the intermediate Ov at the level comparable to Fig. 2A4 for sampling other subdivisions. These levels were chosen to obtain the most unambiguous identification of each subdivision based on general cytoarchitecture. For each selected section, image tiles were captured at 16 bits with a 40× lens and an Axiocam 503 color camera mounted on a Zeiss Imager M2 microscope. While imaging, a software Autofocus program in the Zeiss Zen software was applied to ensure all image tiles were in focus. The image tiles were then montaged using the tiling function of the Zeiss Zen software. For each image, all cells that can be unambiguously assigned to a specific subdivision and with an identifiable cell boundary and a well-defined nucleus were included in the analysis. For each included cell, the cross-sectional somatic area and the cell diameter along the long axis were measured using Fiji software (version 1.50e; National Institute of Health). No corrections were made for tissue shrinkage. Frequency histogram of these measured properties was plotted for individual animals. Measurements from three animals reveal comparative patterns of neuronal cell size between the Ov subdivisions.
Figure 2.
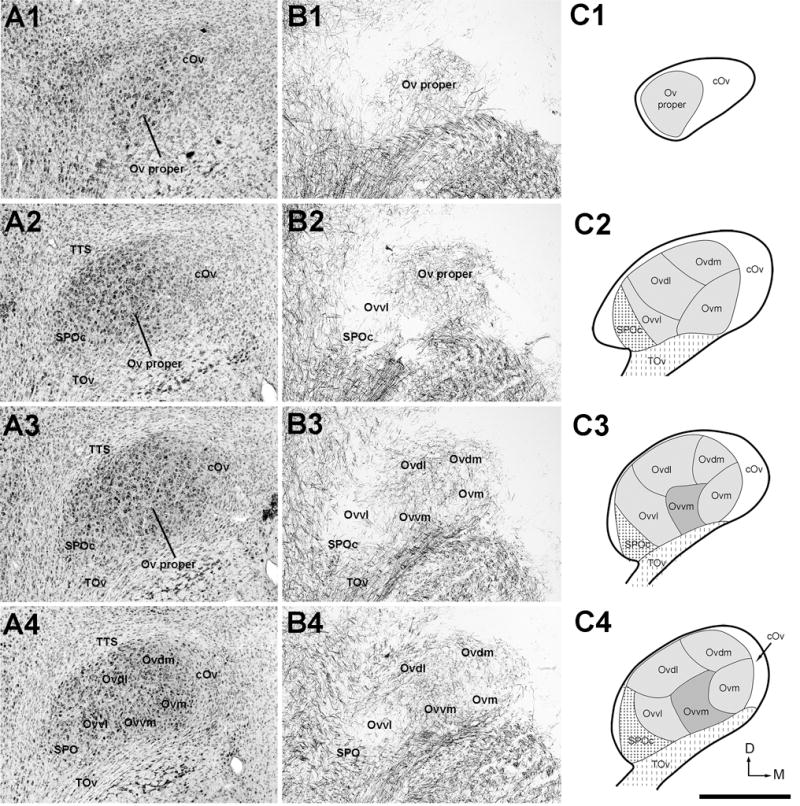
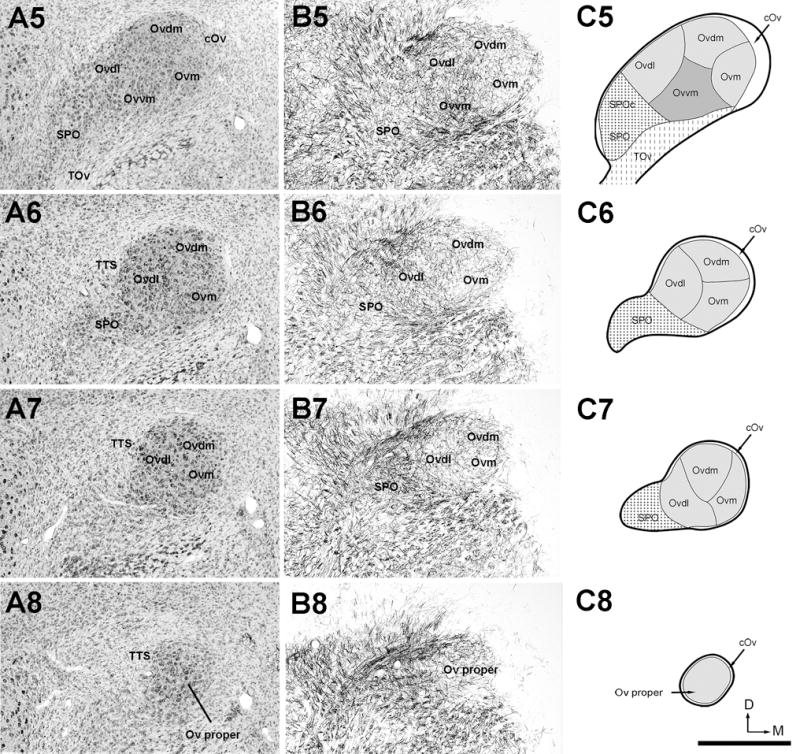
The organization of the Ov complex. A, Series of evenly spaced images taken from Nissl-stained sections through the Ov complex from caudal (A1) to rostral (A8). The images were taken from every third sections of 30 μm thick, so that the distance between images are 90 μm. B, Series of images taken from myelin-stained sections of the same animal from caudal (B1) to rostral (B8). Each image in B was from an adjacent section to the corresponding image in A. All images are in the coronal plane. Dorsal is up and lateral is left. A4 and B4 are shown with a higher magnification in Figure 3. C, Schematic drawings of identified subregions of the Ov complex. Drawings from C1 to C8 are arranged from caudal to rostral, corresponding to the levels illustrated in the images in A and B. The Ov complex includes three major regions, the Ov proper comprised of five neuronal clusters, SPO/SPOc, and cOv. The dorsal is up and the right is medial. Scale bar = 500 μm.
The same sampling approach was applied for measuring somatic size of the cells immunoreactive to each specific biomarker (α8 nAChR, CGRP and CCK). The difference is that these cells were measured from sections immunostained for a specific biomarker instead of Nissl stain. The criteria for including a cell into the analysis include 1) the cell can be unambiguously assigned to Ovvm (for α8 nAChR) or cOv (for CGRP and CCK), 2) the cell has an identifiable cell boundary and a well-defined nucleus, 3) the cell is immunoreactive to the specific marker of interest. A frequency histogram of these measured properties was plotted for individual animals. Measurements from three animals reveal comparative patterns of cell size of immunoreactive neurons to a specific marker.
Imaging
Digital images of selected sections and cells were captured either with a Nikon D100 digital camera mounted on a Nikon photomicroscope (Nikon Corp.; Tokyo, Japan) or an Axiocam 503 color camera mounted on a Zeiss Imager M2 microscope (Carl Zeiss; Jena, Germany). Image brightness, contrast and gamma adjustments were performed using Adobe PhotoShop (Adobe System, Mountain View, CA). Drawings were produced in Adobe PhotoShop or Illustrator (Adobe System).
Results
The chicken Ov is a distinct cell group, encapsulated by the tractus ovoidalis (TOv) and the tractus thalamostriaticus (TTS; Fig. 2). TOv extends from the supraoptic decussation and reaches the Ov ventrolaterally. TTS extends rostrally beyond the Ov, forming the medial portion of the fasciculus prosencephalic lateralis. Small neurons are embedded in both TOv and TTS, with their cell bodies elongated parallel to the fiber tracts. The Ov is oval in shape with the long axis oriented from dorsomedial to ventrolateral. In 2–5 days old chicks, the long and short axes of the Ov are roughly 1200 and 700 μm, respectively, in the coronal plane. The rostrocaudal dimension of the Ov is approximately 800 μm.
Heterogeneous cytoarchitecture of the Ov complex
Neuronal cell bodies and myelinated fibers are not distributed uniformly within the Ov. Examination of alternate serial sections stained for Nissl, myelin, and both, from the same animals, allows identification of three major regions, a major central region (Ov proper) and the nucleus semilunaris parovoidalis (SPO) surrounded by a rim area, the circum-ovoidalis (cOv; Fig. 2 and Fig. 3).
Figure 3.
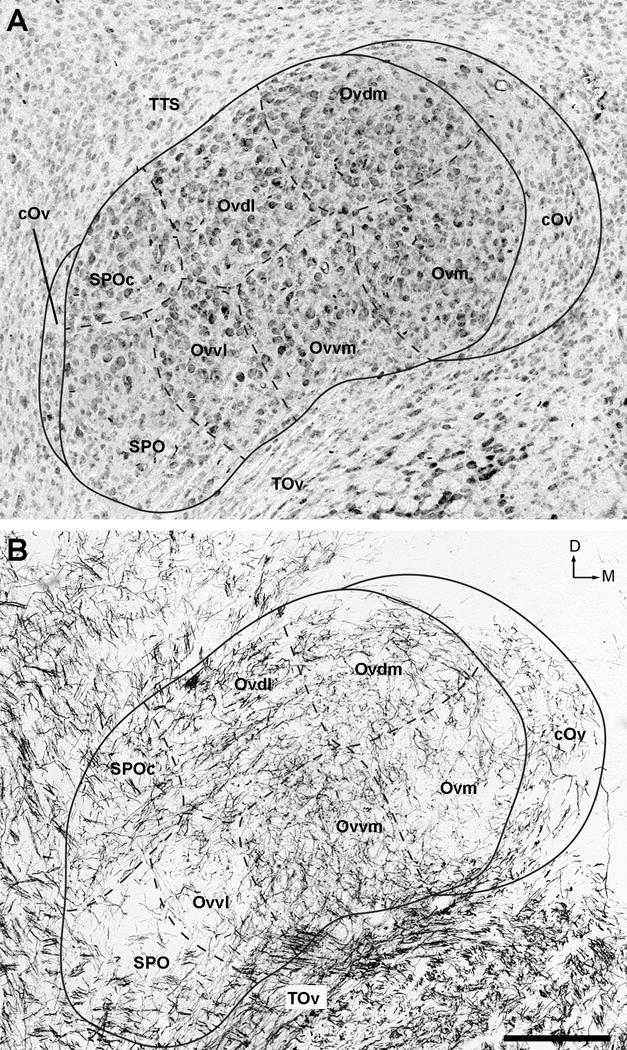
High-magnification images of the Ov complex in Nissl (A) and myelin-stained (B) sections. Solid and dashed lines outline approximate borders between the Ov subdivisions. Note varied cell size as well as different density and orientation of myelinated fibers between these subdivisions. The dorsal is up and the right is medial. Scale bar = 200 μm.
Within the Ov proper, neuronal density is largely uniform, although it is relatively lower at the ventral base where TOv enters. In Nissl-stained sections, five clusters of neurons are recognized within the Ov proper. Based on the position, they are named the Ov pars medialis (Ovm), Ov pars dorsomedialis (Ovdm), Ov pars dorsolateralis (Ovdl), Ov pars ventromedialis (Ovvm) and Ov pars ventrolateralis (Ovvl). Each neuron cluster extends widely along the rostrocaudal dimension, with the exception of Ovvl that is mostly located in the caudal half of the Ov proper.
The five neuron clusters differ in the size of their cell bodies (Figs. 3A). In general, 25.4% neurons in the Ov proper are small (<15 μm in diameter), 67.4% are medium (15–25 μm), and 7.2% are large (> 25 μm). The most frequent range of cell size is smaller in Ovm (15.0–17.5 μm; Fig. 4B) than in other clusters (17.5–20.0 μm; Fig. 4A). In addition, most of the large neurons are found in the three more laterally located clusters (Ovdl, Ovvm, and Ovvl). These differential distribution patterns result in significantly larger neuronal size on average in the lateral (Ovdl, Ovvm, and Ovvl) than in the medial clusters (Ovm and Ovdm; p < 0.01; n = 20–40 cells each cluster from each animal.
Figure 4.
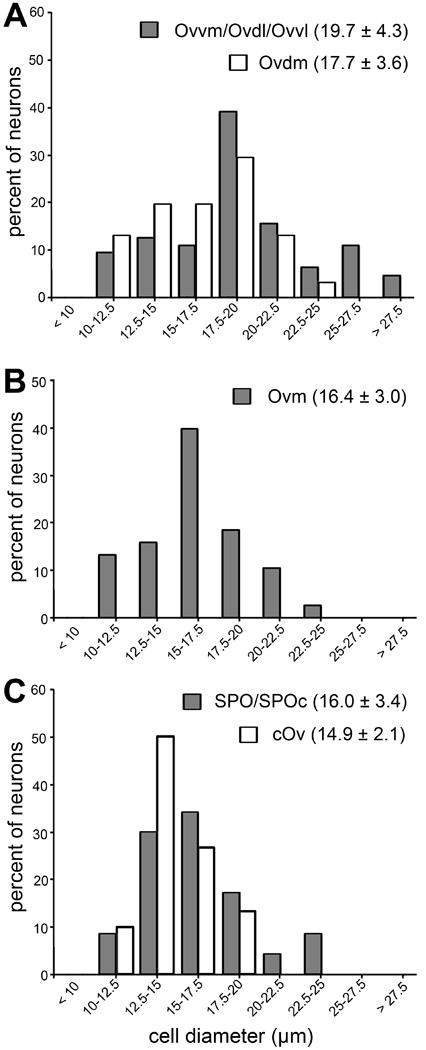
Frequency histogram of neuronal cell diameter in Ov subdivisions. Cell diameter was measured as described in Methods and Materials. Cells in Ovvm, Ovdl, and Ovvl do not differ significantly from each other in cell diameter, and are grouped for clarity. Similarly, SPO and SPOc are grouped. Each data point represents the percentage of neurons with the cell diameter within the assigned value of the bin. The peak of individual histograms indicates the most frequent range of cell diameter for each subdivision/group. The mean and standard deviation of cell diameter among all measured neurons in each group is indicated for each histogram.
These five clusters are also readily identified in myelin-stained sections as they contain myelinated fibers of different densities and orientations (Figs. 2B and 3B). Ovm and Ovvl contain sparse myelinated fibers, separated by fiber-rich regions of Ovdl and Ovvm. The latter two clusters differ from each other by distinct fiber orientations, lateromedial in Ovdl and dorsoventral in Ovvm. Ovdm contains fibers in a moderate density without predominant orientation.
The SPO is located ventrolaterally to the Ov proper and stained more lightly than the Ov proper in Nissl-stained sections. At the caudal level, SPO is immediately lateral to Ovvl and is distinguished from Ovvl by lower packing density and smaller cell sizes (Figs. 2, 3, 4C). Rostrally where Ovvl disappears, SPO increases in size and forms a tadpole tail-like structure, containing a high density of myelinated fibers. Although the caudal and rostral portions of SPO appear continuous with each other in cytoarchitecture, they differ in several biochemical and connective features (see below). As the rostral portion of the SPO is comparable to the classical definition of SPO in pigeons (Karten, 1967), we refer to the caudal and rostral portions of the chick SPO as SPO pars caudalis (SPOc) and SPO. Both SPOc and SPO display notably lower intensities of acetylcholinesterase activity as compared to the Ov proper (Fig. 5).
Figure 5.
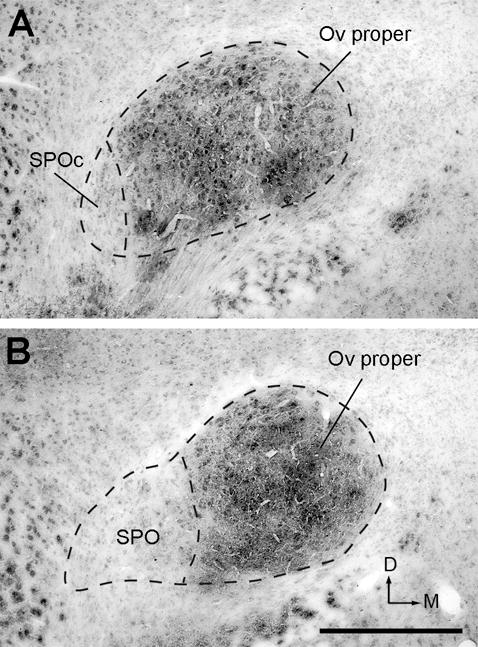
Acetylcholinesterase activity in the Ov complex. Image in A was taken from a section more caudal than that in B. Note light staining in SPO and SPOc as compared to dark staining in the Ov proper. The dorsal is up and the right is medial. Scale bar = 500 μm.
The cOv, surrounding the Ov proper as well as partially the SPO/SPOc, contains the smallest cells of the Ov complex (Figs. 2–3). The average cell size of the cOv is 14.9 ± 2.1 μm (n=30 each animal) and the most frequent range of cell size is 12.5–15.0 μm (Fig. 4C). The cOv has a large, distinct caudomedial sector, while the lateral portion of the cOv is thin, containing only scattered cells along the boundary of the Ov proper. These cells are most easily identified by their specialized biochemistry (see below).
The Ov proper also displays a heterogeneous distribution of astrocytes, using GFAP as a biomarker (Fig. 6A–D). Strong GFAP labeling was seen in the cOv and SPO, in particularly along the outer boundary of the medial cOv (Fig. 6B, D, G–H). Within the Ov proper, intense staining was consistently found in the two medial clusters, Ovdm and Ovm (Fig. 6F). Ovvl also contains substantial staining, while Ovdl, Ovvm and SPOc is generally low in GFAP immunoreactivity (Fig. 6E). GFAP staining displayed a patchy distribution pattern and thus is not a suitable marker for visualizing the exact boundaries between Ov subregions.
Figure 6.
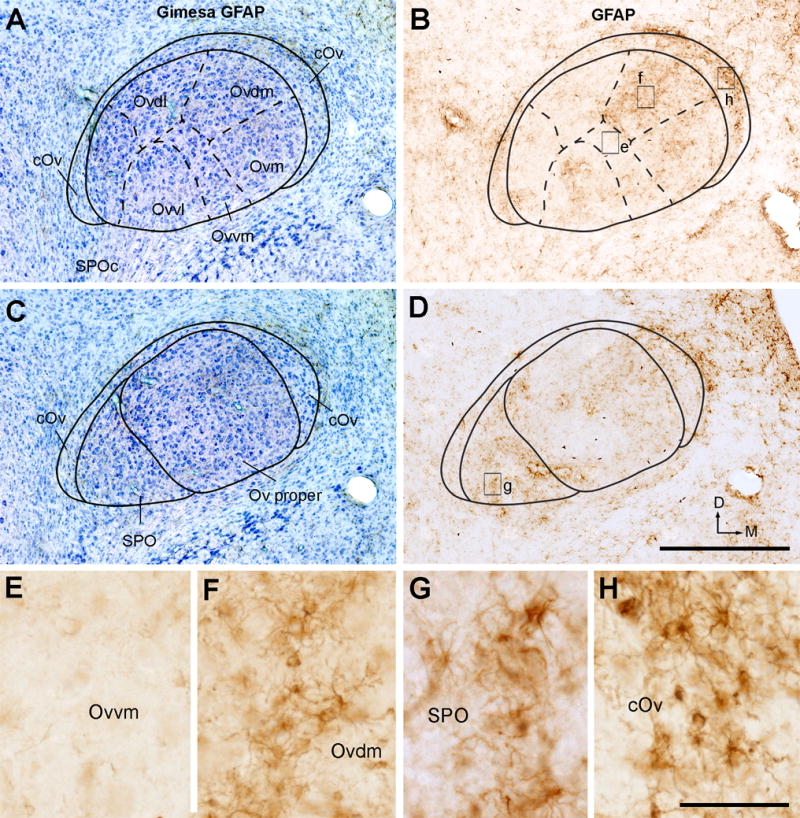
Immunoreactivities for GFAP. A, The Ov at the intermediate level from a section stained for GFAP immunoreactivity (black) and Giemsa counterstain (blue). B, GFAP immunoreactivity only. The image was taken from an adjacent section to A. The Ov subdivisions were outlined based on Giemsa stain (solid and dashed lines). C, The Ov at the rostral level stained for GFAP immunoreactivity (black) and Giemsa counterstain (blue). D, GFAP immunoreactivity only. The image was taken from an adjacent section to C. The Ov subdivisions were outlined based on Giemsa stain (solid and dashed lines). E–H, Closer views of the boxes in B and D. Note darkly labeled glial cells in Ovdm (F), SPO (G), and cOv (H), but not in Ovvm (E). The dorsal is up and the right is medial. Scale bar = 500 μm in D (applies to A–D), 50 μm in H (applies to E–H).
Distinct biochemistry of the Ov complex
CGRP and CCK immunoreactivities
CGRP and CCK are two biochemical markers for the cOv. For each marker, the cOv contains a high density of darkly labeled neurons, in contrast to generally unstained Ov proper (Fig. 7). These immunoreactive neurons are small (CGRP: 13.9 ± 2.1 μm; CCK: 13.5 ± 2.3 μm; n=30 for each animal), comparable to the average size of all neurons in the cOv as measured from Nissl-stained sections. SPO also contains darkly labeled neurons, but clearly not all neurons in SPO are labeled. Some weakly labeled neurons were found in SPOc, as well as occasionally within the Ov proper particularly along its boundaries.
Figure 7.
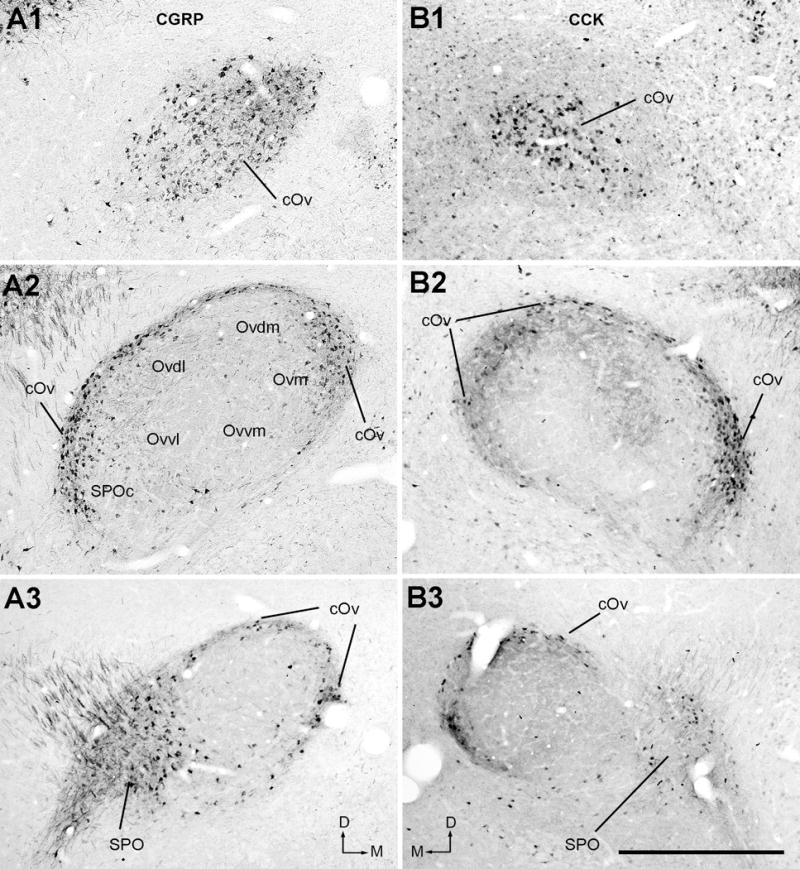
Immunoreactivities for CGRP (A) and CCK (B). Photos were taken from the caudal (A1 and B1), intermediate (A2 and B2) and rostral (A3 and B3) levels of the Ov complex. Note darkly labeled neurons in the cOv and SPO/SPOc. The dorsal is up and the right is medial in A. The dorsal is up and the left is medial in B. Scale bar = 500 μm.
Parvalbumin immunoreactivity
The overall staining pattern of parvalbumin immunoreactivity is complementary to that of CCK immunoreactivity within the Ov (Fig. 8F–H). The Ov proper and SPOc contain high densities of stained neuropil and cell bodies, while SPO and cOv do not display significant staining (Fig. 8A, E). The intensity of stained neuropil is notably higher in Ovdl, Ovvm, and Ovdm (Fig. 8B) than in Ovm (Fig. 8C), Ovvl and SPOc (Fig. 8D). Stained cell bodies are mostly located in Ovdl, Ovvm, and Ovdm and only occasionally in Ovvl.
Figure 8.
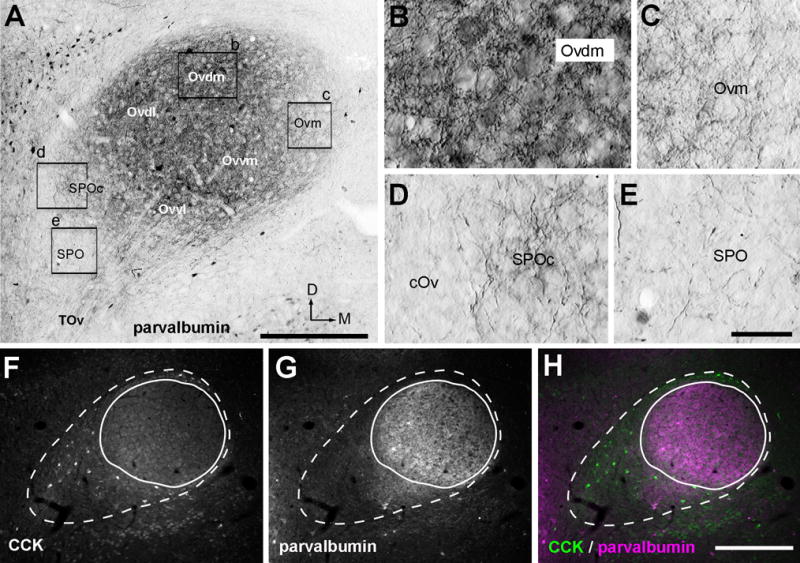
Immunoreactivities for parvalbumin. A, Photomontage images illustrating parvalbumin immunoreactivity in the Ov at the intermediate level. B–E, Closer views of the boxes in A. Ovdm contains a high density of labeled fibers and darkly labeled cell bodies (B). In contrast, staining is light in SPOc (D) and Ovm (C) and not substantial in the cOv (D) and SPO (E). All images in A–E are Normarski. F–H, Double labeling of immunoreactivities for CCK (F) and parvalbumin (G) at the rostral level of the Ov. H is the merged image. Dashed line indicates the border of the entire complex, while solid line indicates the Ov proper only. The dorsal is up and the right is medial. Scale bar = 400 μm in A; 100 μm in E (applies to B–E), 400 μm in H (applies to F–H).
α8 subunit nAChR immunoreactivity
Immunostaining for α8 subunit nAChR is distributed in a restricted area of the Ov proper that largely overlaps with the location of Ovvm (Fig. 9A). In addition, a few stained neurons were found in Ovvl, SPO, and SPOc. The immunoreactivity in Ovvm is comprised of cell bodies and their primary dendrites (Fig. 9B). Even though the stained neurons are distributed widely in the Ovvm, not all neurons within the Ovvm are immunoreactive. Immunoreactive neurons are usually small, intermixed with unstained large and small neurons (arrows and arrowheads in Fig. 9B). The diameter of the immunoreactive neurons are most frequently 12.5–15 μm and no more than 20 μm (Fig. 9C).
Figure 9.
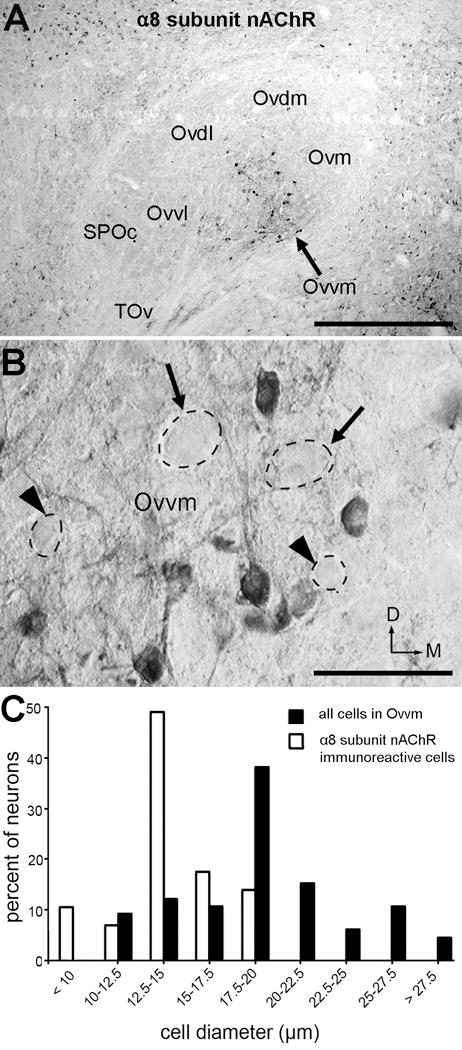
Immunoreactivity for α8 subunit nAChR. A, Bright-field image through the middle of the Ov. Note the majority of immunoreactive neurons are located in the Ovvm. B, Normarski image of the Ovvm at a higher magnification. Arrows and arrowheads indicate unstained large and small neurons, respectively. C, Frequency histogram of cell diameter of immunoreactive neurons (dashed lines) in Ovvm. The frequency histogram for all neurons in Ovvm measured from Nissl-stained sections (solid line) is shown as a comparison. The dorsal is up and the right is medial. Scale bar = 500 μm in A; 50 μm in B.
Differential midbrain projection upon the Ov complex: CTB injections into MLd/ICo
Based on the organization of afferent inputs from the brainstem, our previous study has identified three subdivisions of the chicken auditory midbrain, the NL-recipient zone, the NA-recipient zone, and the RI-recipient zone of MLd (Wang and Karten, 2010). In the current study, we have mapped the distribution patterns of anterogradely labeled axonal terminals in the Ov complex by placing cholera toxin B subunits (CTB) into various locations of the MLd and its surrounding areas (Fig. 10).
Figure 10.
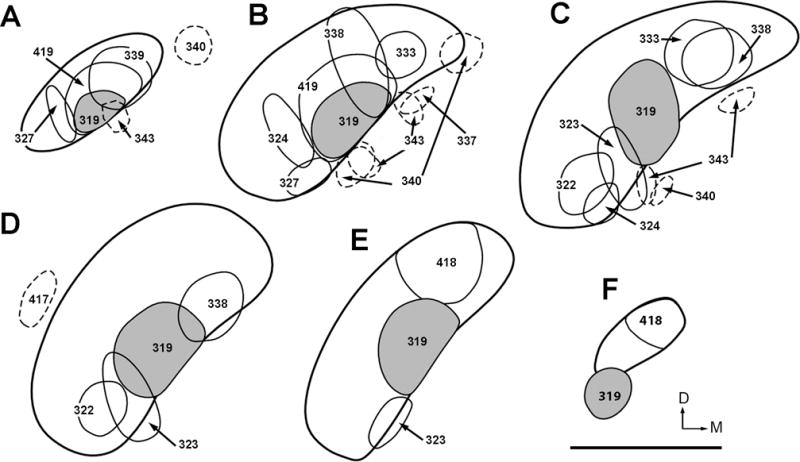
Line drawings illustrating the injection sites of CTB within MLd (solid lines) and the adjacent ICo (dashed lines). The drawings are arranged from caudal (A) to rostral (F). Case numbers are indicated. Case 319 (solid grey) involves the NL-recipient zone of MLd. Case 340 and 343 received two injections each. The dorsal is up and the right is medial. Scale bar = 1 mm.
Regardless of the injection sites, anterogradely labeled axons travel bilaterally, joining the TOv, and terminate within the Ov on both sides of the brain. The contralateral MLd fibers pass through the dorsal supraoptic decussation (DSOD; Fig. 11C), consistent with the report in pigeons (Karten, 1967). In most cases (10 out of 11) with injections into MLd, labeled cell bodies were found embedded in or immediately adjacent to labeled axons in the ventral portion of TOv (Fig. 11A). These labeled neurons were found only on the side ipsilateral to the injection site (Fig. 11A–B). Within the Ov complex, labeled axonal terminals are distributed in different areas depending on the injection sites (Fig. 12). Across all injection cases, each Ov subregion, except for SPOc, contains substantial axonal terminals. In each case, the distribution pattern of labeled terminals in the Ov is largely symmetric between the two sides of the brain. The density of labeled axons in the ipsilateral projection is either consistently greater than or approximately equal to the contralateral one, depending on the location of the injection.
Figure 11.
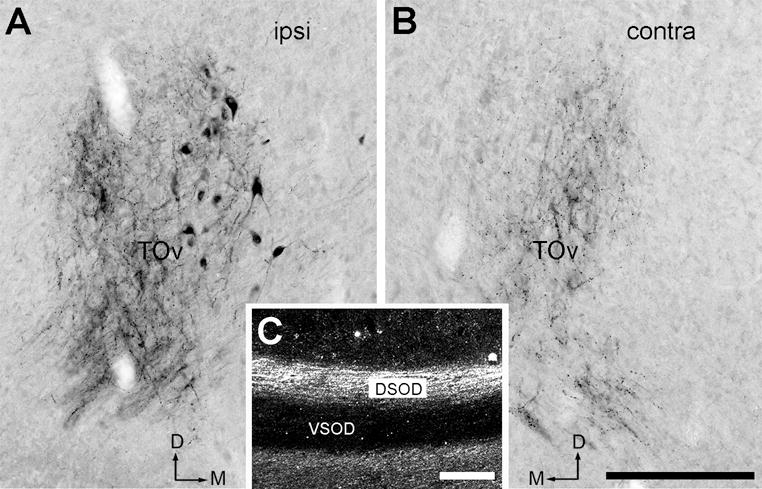
CTB-labeled MLd axons. A–B, Bright-field images showing anterogradely labeled axons in both the ipsilateral (A) and contralateral TOv (B). Labeled cell bodies are only found ipsilaterally. C, Dark-field image demonstrating the crossed MLd fibers passing through DSOD, but not VSOD. Images were taken from case 419. The dorsal is up and the right is medial in A. The dorsal is up and the left is medial in B. Scale bar = 200 μm in B (applies to A–B) and in C.
Figure 12.
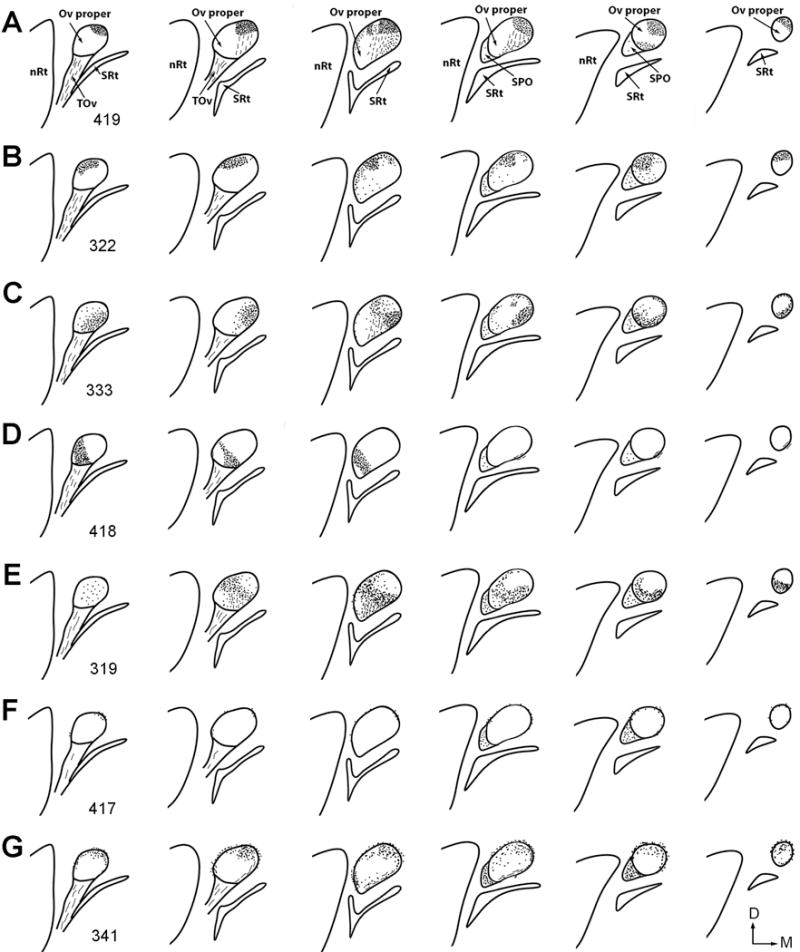
Line drawings of differential distribution of anterogradely labeled axons in the Ov complex following CTB injections into the MLd and ICo. Injection sites are illustrated in Figure 10. Dots and dashed lines indicate labeled terminals and axons, respectively. For each case, drawings are arranged from caudal (lateral) to rostral (medial). Case number is indicated in the first drawing of each case. Microphotographs of selected cases are illustrated in Figures 13–18.
Injections into the NA-recipient zone of MLd
The NA-recipient zone is the largest subdivision of the MLd, occupying the major portion of the nucleus except for a small, restricted area in the middle (NL-recipient zone) and the most rostromedial region (RI-recipient zone; Wang and Karten, 2010). Individual injections usually involve only one portion of the NA-recipient zone. Following injections concentrated in the caudal MLd (cases 419, 327, 339), the majority of labeled axons in the Ov coursed medially and dorsally along its ventral boundary, terminating primarily in the Ovdm on both sides of the brain (Fig. 13A–C). The projection into the ipsilateral Ovdm was relatively more dense than that to the contralateral Ovdm. In case 419 with a relatively large injection, the ipsilateral projection also extended into a small portion of the Ovdl, Ovm, and the lateral cOv (Fig. 13B–C, E–F). Staining in these regions was sparse in cases 327 and 339 with smaller injections (Fig. 13D). Similarly, labeled terminals were found in SPO, with a higher density in case 319 than in the other two cases. Labeling in the Ovvm and Ovvl was primarily passing axons (Fig. 13I). No substantial labeling was consistently detected in SPOc or the medial cOv. Terminals in SPO contained mostly small-size boutons (Fig. 13J), in contrast to the large boutons found in the Ovdm and Ovdl (Fig. 13G–H).
Figure 13.
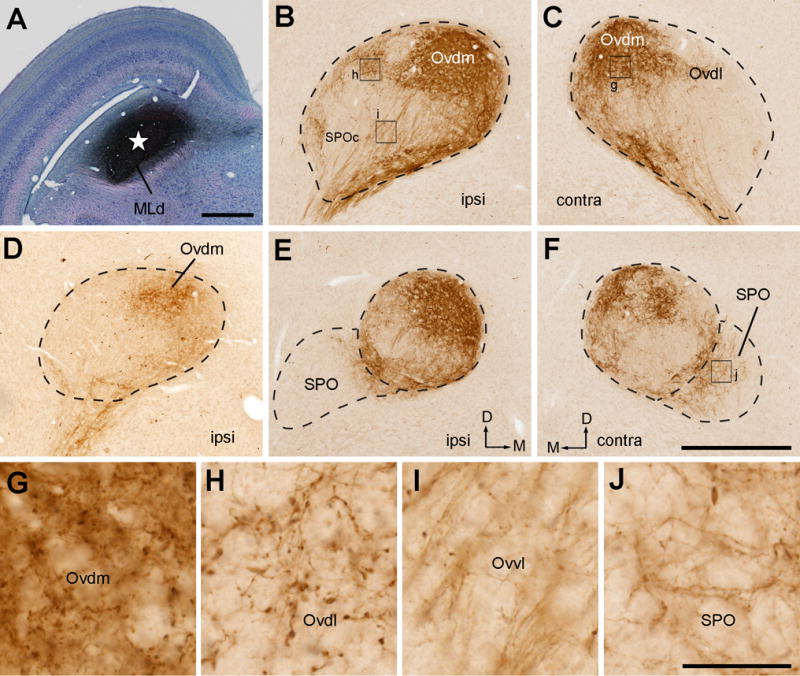
Photomicrographs of anterogradely labeled terminals following CTB injection into the caudal MLd (NA-recipient zone). All images were taken from case 419, except that D was taken from case 339. A, Giemsa-counterstained section showing the injection site at the most caudal level of MLd. Star indicates the center of the injection site. B–C, Anterogradely labeled terminals in the ipsilateral (B) and contralateral (C) Ov at the intermediate level. The highest density of labeled terminals is located in Ovdm. D, Anterogradely labeled terminals in the ipsilateral Ov from a case with a smaller injection (case 339), showing similarly strong and confined labeling in Ovdm. E–F, Anterogradely labeled terminals in the ipsilateral (E) and contralateral (F) Ov at the more rostral level. In addition to Ovdm, substantial labeling was also seen in SPO. G–J, Closer views of the boxes in B–F. Dashed lines indicate the approximate borders of Ov and SPO. Note smaller bouton sizes in SPO as compared to other divisions. The dorsal is up. The medial is right in A–B, D–E and left in C and F. Scale bars = 500 μm in A, 500 μm in F (applies to B–F); 50 μm in J (applies to G–J).
Figure 14 illustrates an injection into the ventral MLd at the intermediate level (case 322). The tracer also diffused into the external nucleus (E) of ICo (see the nomenclature below). Anterogradely labeled terminals were found mostly in the dorsal half of the Ov proper, with the greatest density in Ovdl (Fig. 14A–C, E–F). Similarly, the ipsilateral projection is notably more dense than the contralateral one. SPO and SPOc contain a low density of labeled terminals. Heavy terminal labeling in Ovdl was consistently found in two other cases that involve a substantial portion of the ventral MLd (cases 323 and 324), although strong labeling was also detected in Ovm in these two cases (Fig. 14D). Again, labeled terminal boutons in SPO (Fig. 14I) appear smaller in size than the boutons in Ovdl (Fig. 14G) and Ovvm (Fig. 14H).
Figure 14.
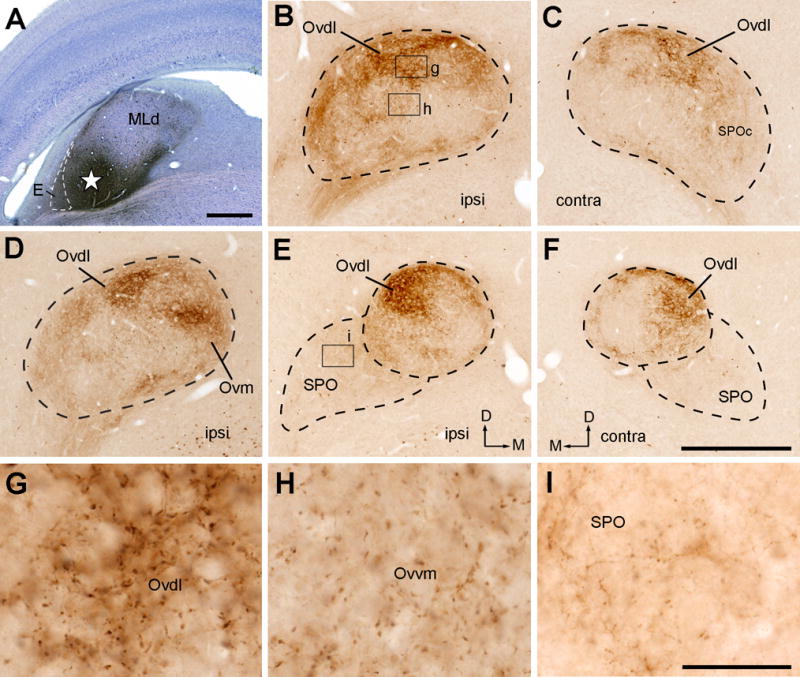
Photomicrographs of anterogradely labeled terminals following CTB injection into the ventral MLd (NA-recipient zone). All images were taken from case 322, except that D was taken from case 324. A, Giemsa-counterstained section showing the injection site in the MLd (star). Direct tracer diffusion was also found in E of the ICo (indicated by dashed line). B–C, Anterogradely labeled terminals in the ipsilateral (B) and contralateral (C) Ov at the intermediate level. The highest density of labeled terminals is located in Ovdl. D, Anterogradely labeled terminals in the ipsilateral Ov in Case 324, showing strong labeling in both Ovdl and Ovm. E–F, Anterogradely labeled terminals in the ipsilateral (E) and contralateral (F) Ov at the more rostral level. G–I, Closer views of the boxes in B and E. Note smaller bouton sizes in SPO as compared to other divisions. Dashed lines indicate the approximate borders of Ov and SPO. The dorsal is up. The medial is right in A–B, D–E and left in C–F. Scale bars = 500 μm in A, 500 μm in F (applies to B–F); 50 μm in I (applies to G–I).
Injections primarily involving the dorsal MLd demonstrated heavy terminal labeling in Ovm and relatively lighter labeling in Ovdm (Fig. 15A–F; cases 333, 338 and 340). A low density of labeled terminals were also seen in Ovvm, probably due to an overlap of the injection site with the adjacent NL-recipient zone of MLd. The cOv and SPO displayed low densities of anterograde staining while SPOc was devoid of terminals. The distribution pattern of the contralateral projection was comparable to the ipsilateral projection, however, with a lower intensity. Consistent with injections into the caudal and dorsal MLd, the size of labeled boutons is smaller in SPO (Fig. 15I), as compared to medium- to large-sized boutons in Ovdm (Fig. 15G) and Ovm (Fig. 15H).
Figure 15.
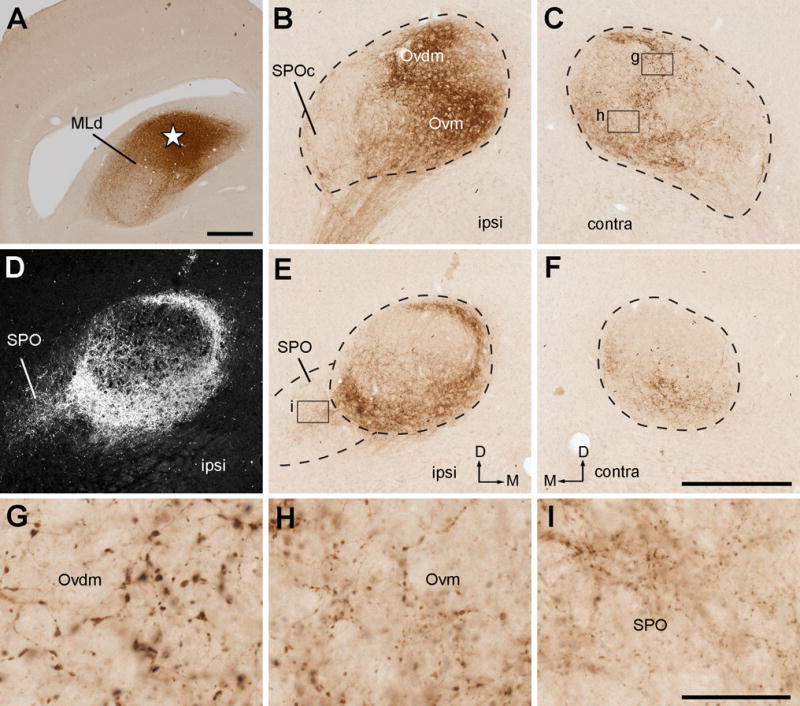
Photomicrographs of anterogradely labeled terminals following CTB injection into the dorsal MLd (NA-recipient zone). All images were taken from case 333. A, The injection site in the MLd (star). B–C, Anterogradely labeled terminals in the ipsilateral (B) and contralateral (C) Ov at the intermediate level. The highest density of labeled terminals is located in Ovm. D, Dark-field image of the section in E, showing the labeling in SPO in addition to the Ov proper. E–F, Anterogradely labeled terminals in the ipsilateral (E) and contralateral (F) Ov at the more rostral level. G–I, Closer views of the boxes in B and E. Labeled terminal boutons are larger in Ovdm (G) than in Ovm (H) and SPO (I). Dashed lines indicate the approximate borders of Ov and SPO. The dorsal is up. The medial is right in A–B, D–E and left in C–F. Scale bars = 500 μm in A, 500 μm in F (applies to B–F); 50 μm in I (applies to G–I).
Injections into the RI-recipient zone of MLd
The RI-recipient zone of MLd is located in its most rostromedial region (Wang and Karten, 2010). An injection into this region demonstrated restricted distribution of dense terminals within Ovvl in the caudal half of the Ov proper (Fig. 16A–F; case 418). The staining density appears similar in the two sides of the brain. At the more rostral level, a small bundle of labeled axons was found extending rostrally along the ventral border of the Ov proper (Fig. 16G–I). No obvious terminals were found within the remaining region of the Ov except for few scattered axons in SPO.
Figure 16.
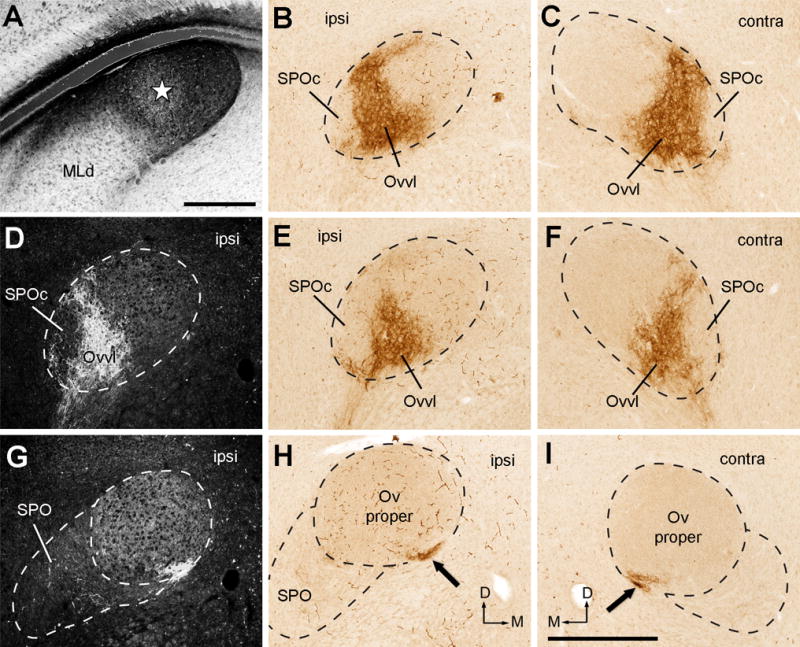
Photomicrographs of anterogradely labeled terminals following CTB injection into the rostromedial MLd (RI-recipient zone). All images were taken from case 418. A, Dark-field image showing the injection site in the MLd (star). B–C, Anterogradely labeled terminals in the ipsilateral (B) and contralateral (C) Ov at the intermediate level. Labeled axonal terminals are restricted in Ovvl on either side. D–F, Dark-field (D) and bright-field images (E–F) of anterogradely labeled terminals in the ipsilateral (D–E) and contralateral (F) Ov at the more rostral level. G–I, Dark-field (G) and bright-field images (H–I) of anterogradely labeled terminals in the ipsilateral (G–H) and contralateral (I) Ov at the most rostral level. Arrows indicate labeled axon bundles along the ventral edge of Ov. Very little staining was found in other Ov subdivisions and SPOc/SPO. Dashed lines indicate the approximate borders of Ov and SPO. The dorsal is up. The medial is right in the first two columns (A–B, D–E, G–H) and left in the far right column (C, F, I). Scale bars = 500 μm in A, 500 μm in I (applies to B–I).
Injections involved the NL-recipient zone of MLd
The NL-recipient zone of the MLd is a small central region along the medial border of the nucleus at the intermediate level (Wang and Karten, 2010). The injection in case 319 targeted this small area as well as the surrounding area outside of the MLd (Fig. 17A). Within Ov, dense neuropil labeling was found in the middle of the Ov, particularly concentrated bilaterally in Ovvm and ipsilaterally in Ovdl (Fig. 17B–C, 17E–F). These terminals showed medium-sized boutons (Fig. 17D). On the ipsilateral side, labeled axons and terminals were also seen in SPO, Ovvl and at lower densities in the lateral portion of the cOv. The remaining regions of the Ov including SPOc, Ovdm, Ovm, and the large medium body of the cOv, lack significant staining on either side of the brain.
Figure 17.
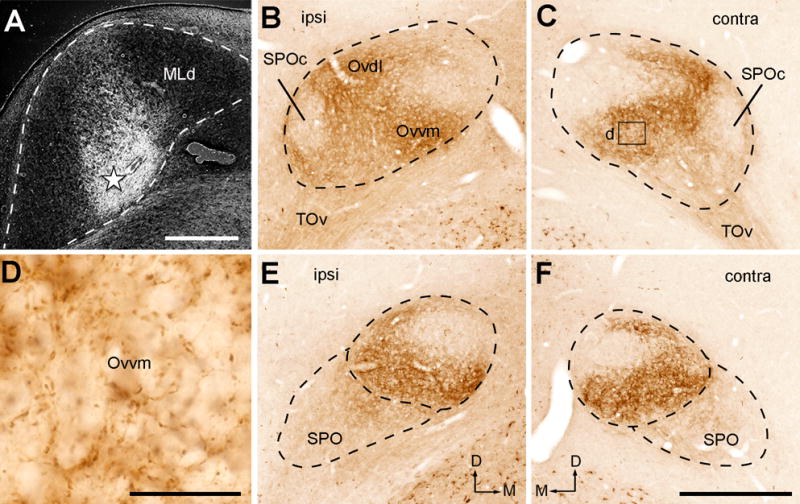
Photomicrographs of anterogradely labeled terminals following CTB injection into the NL-recipient zone of MLd. All images were taken from case 319. A, Dark-field image showing the injection site in MLd (star). B–C, Anterogradely labeled terminals in the ipsilateral (B) and contralateral (C) Ov at the intermediate level. Labeled axonal terminals are most densely distributed in Ovvm. D, Closer view of the box in C. E–F, Anterogradely labeled terminals in the ipsilateral (E) and contralateral (F) Ov at the more rostral level. Dashed lines indicate the approximate borders of Ov and SPO. The dorsal is up. The medial is right in A, B, E and left in C and F. Scale bars = 500 μm in A, 50 μm in D, 500 μm in F (applies to B–C, E–F).
Injections into the surrounding areas of MLd
There are a number of cell groups and areas surrounding the MLd, named collectively as the nucleus intercollicular area (ICo; Karten, 1967). We adopt the nomenclature of Puelles et al. (1994) for naming individual cell groups. In case 417, the injection was located between the ventricle and the lateral border of MLd. The injection was centered in the toral periventricular lamina (PV; star in Fig. 18A) and also involved the external nucleus of the ICo (E; Fig. 18B). The tracer diffused into the ventricle without entering the MLd significantly. Within the Ov complex, anterograde terminals and axons were mostly confined ipsilaterally in SPO and cOv (Fig. 18C–I). In contrast, the Ov proper and SPOc did not display evident labeling. Similar terminal distribution pattern were found in cases 337 and 343 in which the injection sites were located outside the medial boundary of MLd. Case 340 had two injection sites, one involving the caudomedial shell nucleus of ICo (CM) and a portion of the dorsal MLd, and the other located more ventrally. Consistently, anterograde terminals were found in the ipsilateral SPO and cOv. As expected, additional labeled terminals were seen in Ovdm due to the tracer spreading into the dorsal MLd.
Figure 18.
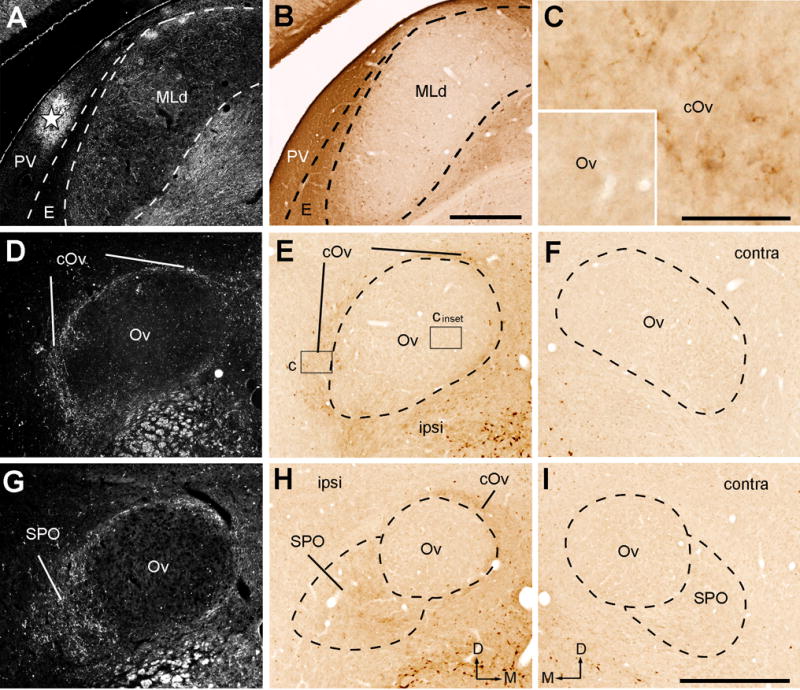
Photomicrographs of anterogradely labeled terminals following CTB injection into the rostromedial MLd (RI-recipient zone). All images were taken from case 417. A, Dark-field image showing the injection site left to the MLd (star). B–C, Closer views of the boxes in E showing no staining in the Ov proper (B) and labeled terminals in the cOv (C). D–F, Dark-field (D) and bright-field images (E–F) of anterogradely labeled terminals in the ipsilateral (D–E) and contralateral (F) Ov at the more rostral level. G–I, Dark-field (G) and bright-field images (H–I) of anterogradely labeled terminals in the ipsilateral (G–H) and contralateral (I) Ov at the most rostral level. Only the cOv and SPO on the ipsilateral side display substantial labeling. Dashed lines indicate the approximate borders of Ov proper and SPO. The dorsal is up. The medial is right in the first two columns (A–B, D–E, G–H) and left in F and I. Scale bars = 500 μm in B (applies to A–B), 50 μm in C (also applies to the inset), 500 μm in I (applies to D–I).
Summary
The cases with CTB injections into MLd and the surrounding areas reveal a number of parallel ascending pathways from the midbrain to the Ov. First, the NA-recipient zone of MLd primarily projects upon three of five neuronal clusters of the Ov proper: Ovdm, Ovdl, and Ovm, with ipsilateral predominance. The caudal, ventral, and dorsal portions of MLd preferentially target the Ovdm, Ovdl, and Ovm, respectively. Second, the RI-recipient zone of MLd projects in a restricted manner to the Ovvl bilaterally. Third, a major target of the NL-recipient zone of MLd is the Ovvm bilaterally, although the possibility that this zone may also innervate Ovdl can not be excluded. Finally, areas surrounding MLd give rise to an ipsilateral projection upon SPO and the cOv. Whether ICo also projects upon the Ov proper can not be determined as our injections located outside of MLd do not cover all areas of ICo.
Differential midbrain projection upon the Ov complex: CTB injections into the dorsal thalamus
We next examined the distribution of projecting neurons in MLd and ICo upon the thalamus by placing CTB into the Ov complex. For injections into the Ov, the micropipette went tangentially from the forebrain across the midline and into the contralateral Ov. Figure 19 illustrates a case with CTB injection covering the rostral half of the Ov including SPO and a substantial portion of the surrounding area (case 478). Retrogradely labeled neurons were found throughout MLd on both sides (Fig. 19A–F; high-magnification images in Fig. 19K–L). In addition, the ICo on the ipsilateral side contains many labeled neurons in particular its lateral and dorsal portions, where E and CM are located (Fig. 19H). The contralateral ICo also contains labeled neurons, but in a notably lower density as compared to its ipsilateral counterpart (Fig. 19G). One exception is distinct cell groups along the medial and ventral edge of MLd which contain a high density of labeled neurons on both sides (Fig. 19A–D; High-magnification images in Fig. 19I–J). These cell groups resemble the location of the Hilar nucleus (H) and the preisthmic superficial area (S) defined by Puelles et al. (1994). These observations demonstrate that midbrain neurons projecting upon the thalamus are distributed throughout MLd and ICo. Ascending pathways arising from MLd, H and S are bilateral, while the pathways arising from the remaining ICo including E and CM are largely ipsilateral. PV contained few labeled cells, indicating its innervation of the auditory thalamus to be light and arguing that identified terminals within SPO following the injection in case 417 (Fig. 18) may largely due to the tracer diffusion into the adjacent E of ICo.
Figure 19.
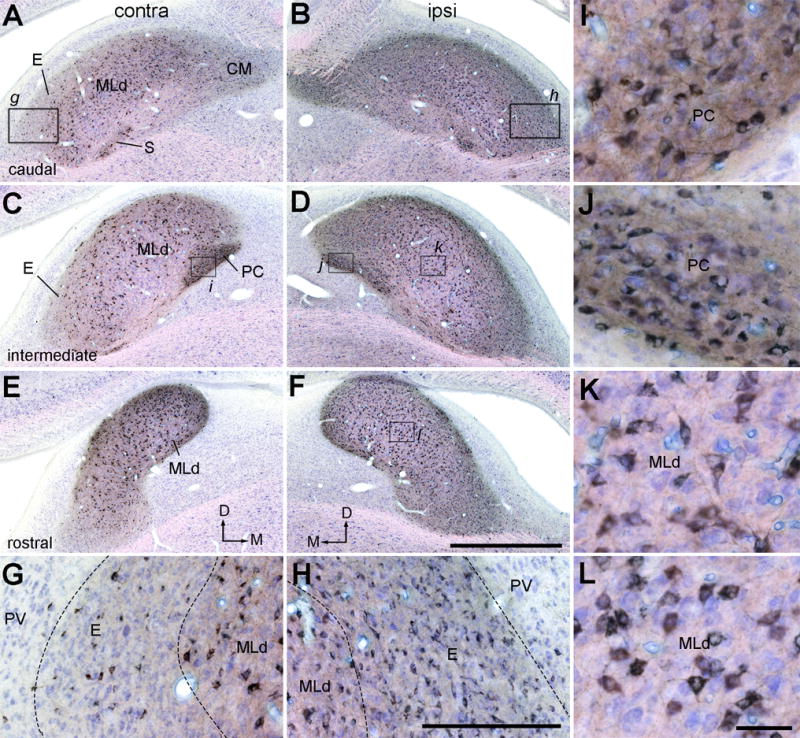
Photomicrographs of retrogradely labeled neurons in MLd and ICo following CTB injection into the Ov complex (case 478). Sections were counterstained with Giemsa so that CTB positive and negative neurons are in black and blue, respectively. A–B, Labeled neurons in the contralateral (A) and ipsilateral (B) MLd at the caudal level. C–D, Labeled neurons in the contralateral (C) and ipsilateral (D) MLd at the intermediate level. E–F, Labeled neurons in the contralateral (E) and ipsilateral (F) MLd at the rostral level. The dorsal is up. The medial is right in A, C and E and the left in B, D, F. G–H, Closer views of the boxes in A and B showing labeled neurons in the external nucleus of ICo with a notably higher density ipsilaterally (H) than contralaterally (G). I–J, Closer views of the boxes in C and D showing high densities of labeled neurons in the Hilar nucleus of ICo on both sides. K–L, Closer views of the boxes in D and F showing labeled neurons in the ipsilateral MLd. Scale bars = 2 mm in F (applies to A–F), 500 μm in H (applies to G–H), 25 μm in L (applies to I–L).
In all 7 cases with injections into the Ov complex, CTB spread into multiple Ov subregions as well as surrounding thalamic areas, thus did not allow us to map the precise organization of the MLd-Ov projection from these cases. In one animal (case 435) where the injection was primarily in the dorsal Ov and SPO, avoiding the ventral Ov including Ovvm and Ovvl, retrogradely labeled neurons in MLd display a notably lower density in the middle and rostromedial portions of MLd as compared to other MLd regions (Fig. 20). This observation is consistent with the notion that the NL-recipient and RI-recipient zones of MLd mostly innervate Ovvl and Ovvm in the Ov complex. Labeled neurons in ICo were mostly located in the E and CM ipsilaterally as well as H and S bilaterally, consistent with the distribution pattern in case 478. In another animal (case 479), CTB injection was concentrated in SPO and the most ventral portion of Ov. Retrogradely labeled neurons were found mostly in ICo as well as the rostromedial region of MLd (Fig. 21), confirming that ICo is the major midbrain input to SPO. As expected, labeled neurons in ICo were located primarily in the E and CM ipsilaterally as well as H and S bilaterally.
Figure 20.
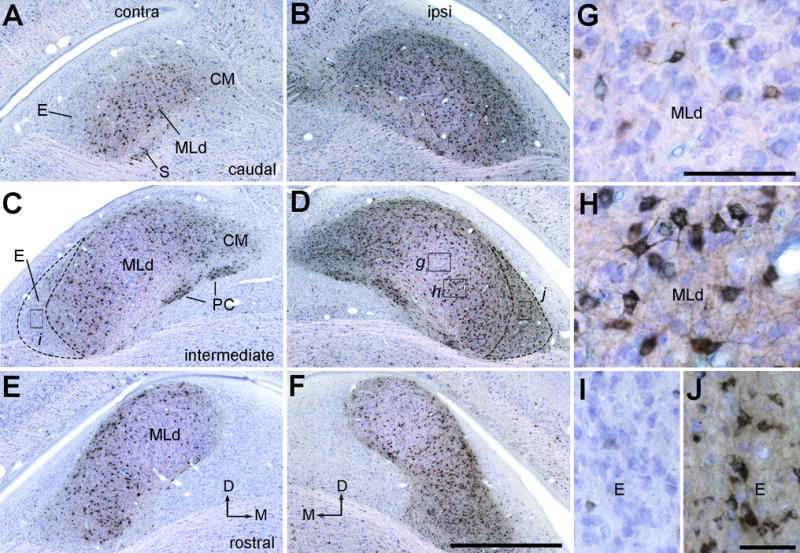
Photomicrographs of retrogradely labeled neurons in MLd and ICo following CTB injection into the Ov complex (case 435). Sections were counterstained with Giemsa so that CTB positive and negative neurons are in black and blue, respectively. A–B, Labeled neurons in the contralateral (A) and ipsilateral (B) MLd at the caudal level. C–D, Labeled neurons in the contralateral (C) and ipsilateral (D) MLd at the intermediate level. E–F, Labeled neurons in the contralateral (E) and ipsilateral (F) MLd at the rostral level. The dorsal is up. The medial is right in A, C, E, and left in B, D, F. G–J, Closer views of the boxes in C and D. Less neurons were labeled in the central (G) and rostromedial MLd than the remaining areas of MLd (H). The external nucleus of ICo contains a notably higher density of labeled neurons ipsilaterally (J) than contralaterally (I). Scale bars = 2 mm in F (applies to A–F), 500 μm in G (applies to G–H), 50 μm in J (applies to I–J).
Figure 21.
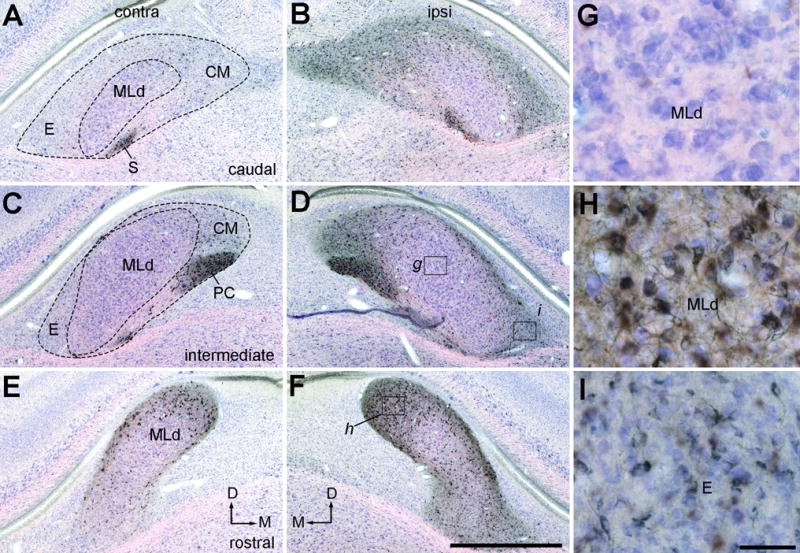
Photomicrographs of retrogradely labeled neurons in MLd and ICo following CTB injection into the Ov complex (case 479). Sections were counterstained with Giemsa so that CTB positive and negative neurons are in black and blue, respectively. A–B, Labeled neurons in the contralateral (A) and ipsilateral (B) MLd at the caudal level. C–D, Labeled neurons in the contralateral (C) and ipsilateral (D) MLd at the intermediate level. E–F, Labeled neurons in the contralateral (E) and ipsilateral (F) MLd at the rostral level. The dorsal is up and the right is medial in A, C, E. The dorsal is up and the left is medial in B, D, F. G–H, Closer views of the boxes in D and F showing labeled neurons in the rostromedial (H), but not other divisions (G), of MLd. I,. Closer views of the box in D showing labeled cells in the ipsilateral external nucleus of ICo. Scale bars = 2 mm in F (applies to A–F), 50 μm in I (applies to G–I).
Ascending projection to the forebrain
To clarify whether all identified Ov subdivisions project upon the Field L in the forebrain, CTB was placed into the Field L in five animals. CCK immunostaining was used for identifying the cOv and SPO. The Ov proper is enclosed by CCK immunoreactive neurons. Among all five cases, retrogradely labeled neurons were found in all neuronal clusters of the Ov proper as well as in SPO and cOv (Fig. 22A–C). Double-labeled cells for CTB and CCK immunoreactivities were occasionally seen in the cOv (Inset in A; arrowhead). To check whether identified Ov subdivisions in the current study projects to the amygdala in addition to the Field L, an injection was made into the nucleus taenia of the arcopallium (Fig. 22D–E). Retrogradely labeled neurons in the thalamus are located outside of the CCK-immunoreactive neurons of the cOv. No double labeled neurons were detected.
Figure 22.
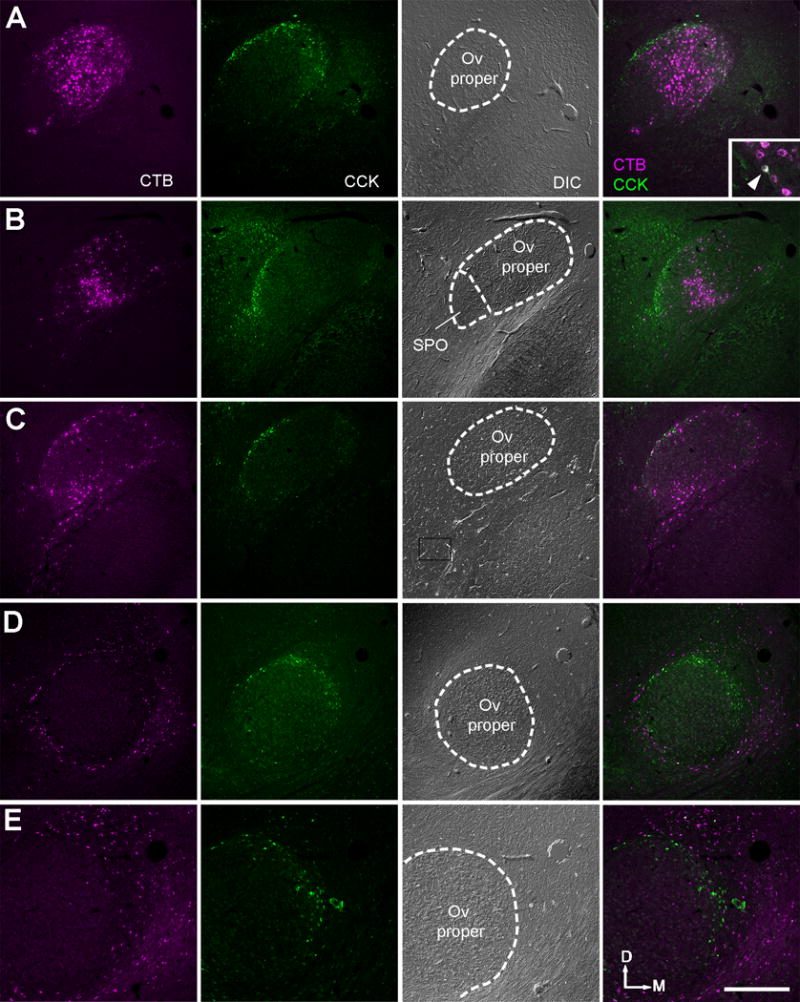
Retrogradely labeled neurons in the Ov complex and surrounding area following CTB injections into forebrain areas. The three left columns are single channel confocal images of CTB, immunoreactivity for CCK, and DIC, respectively. The far right column is the merged images of CTB and CCK. A–C, Retrogradely labeled neurons in Ov are located inside of or overlapped with the cOv indicated by CCK-immunoreactive cells, following injections into the Field L. Double-labeled cells were occasionally seen (Insert in A; arrowhead). D, Retrogradely labeled neurons are located outside of the cOv indicated by CCK-immunoreactive cells, following injections into the nucleus taenia of the arcopallium. E, Higher magnification images of the same case in D. The location is comparable to the box in D. No double-labeled cells were found. The dorsal is up and the right is medial. Abbreviations: see table of abbreviations. Scale bar = 500 μm.
Discussion
This study describes the heterogeneous internal organization of the chicken nucleus ovoidalis (Ov) as well as its afferent inputs from the midbrain. We first discuss the three primary ascending pathways from the MLd to the major body of the Ov in a comparative context. Second, we compared the additional auditory thalamic cell groups identified in birds and clarify the nomenclature of a number of cell groups across studies and species.
The Ov proper and three ascending auditory pathways
It has long been noticed that the Ov proper contains visually identifiable neuronal clusters on the basis of their packing density and cell size in budgerigars (Brauth et al., 1987), pigeons (Wild et al., 1993), and zebra finches (Vates et al., 1996). This is consistent with our findings in chickens, in which we further mapped the location and extent of these clusters in three dimensions. More importantly, we confirmed that this anatomical heterogeneity is functionally significant. In chickens, these clusters are grouped into three subdivisions, innervated respectively by three distinct MLd subdivisions. The NL- and RI-recipient zones of MLd particularly terminate in a ventromedial (Ovvm) and a ventrolateral (Ovvl) portion of the Ov proper, respectively, while the remainder of the Ov proper is primarily innervated by the NA-recipient zone of MLd. Concentrated localization of α8 subunit nAChR-containing neurons in Ovvm further supports its specialization in synaptic connectivity. However, immunocytochemistry did not identify a substantial number of cholinergic neurons in any region of the MLd (Puelles et al., 1994; named Cs and Cc in this study), suggesting additional inputs to and/or local connectivity within the Ovvm.
Combined with our previous study (Wang and Karten, 2010), our data demonstrate three parallel pathways arising from the dorsal brainstem (NA, NL and RI), via the MLd and then arriving in the Ov proper, as summarized in Figure 23. Previous in vivo recording studies have implicated that one pathway encodes signals of very low frequency while the two other pathways process the time and intensity information of relatively higher frequencies at the brainstem and midbrain levels (see discussion in Wang and Karten, 2010). The segregation of the three pathways in the thalamus suggest that individual acoustic cues (low frequency, timing, and intensity) may continue to be processed separately. A notable difference in signal integration is the bilateral nature at the thalamic level as compared to the primarily contralateral projection from NA/NL/RI upon the MLd. We also note that these pathways interconnect with each other through commissural and intrinsic connections at all subcortical levels above NA and NL. Additional ascending pathways involving the cell groups embedded within the lateral lemniscus projecting upon the midbrain and thalamus (Wild, 1987; Krützfeldt et al., 2010b) further enhance the complexity of signaling integration and processing at each brain level. Further investigation is needed to understand how this orderly organized system facilitates the extraction of basic acoustic features at lower levels and leads to the perception of complex natural sounds in the cortex.
Figure 23.
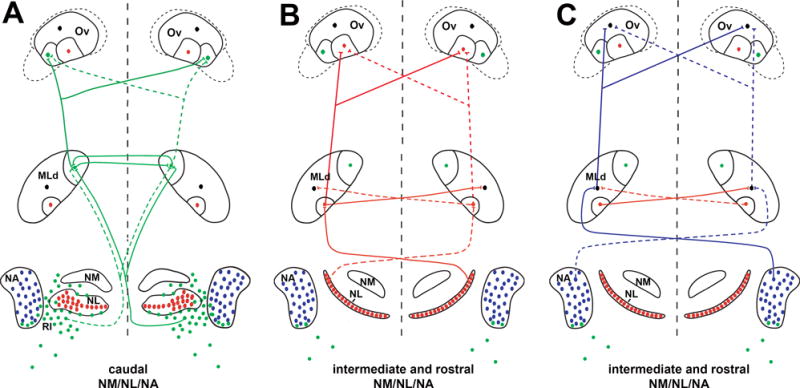
Schematic drawing of the ascending auditory pathways at the brainstem, midbrain, and thalamic levels. A part of the drawing at the brainstem and midbrain levels was previously published in Wang and Karten (2010). The dorsal auditory brainstem sends three separate pathways (green, red, and blue) upon three distinct subdivisions of MLd and then upon three distinct subdivisions of the Ov proper. The blue pathway also integrates information from the red pathway at the midbrain level. Filled circles and lines indicate neurons and connections in each pathway, respectively. At the level of brainstem projection upon the midbrain, solid and dashed lines indicate connections issued from the left and right sides of the midbrain, respectively. For the purpose of the clarity, the red and blue pathways in A are not illustrated; the organization of these connections is the same as demonstrated in B and C. The NA-recipient zone in MLd and Ov, shown as black cells, receives information from both red and blue pathways. This drawing demonstrates strong innervations in the pathways; light or sparse projections are not included, such as ipsilateral projections from NL and NA upon MLd, the light projection from NA upon the NL-recipient zone of MLd, and the connections between the NA-recipient zones of two side. The potential projections from MLd upon SPO and cOv are not unambiguously determined, thus they were not included in the drawing. Abbreviations: see table of abbreviations.
The parallel organization identified in chickens appears to be common in birds. In pigeons, the NL-recipient zone of MLd projects upon a restricted region in the ventral part of the Ov proper (Leibler, 1975), suggesting that the Ov proper may be organized and innervated in a comparable manner in pigeons and chickens. In budgerigars, a ventromedial portion of the Ov was identified on the basis of cytoarchitecture (Brauth et al., 1987; named Ovm in their study). This region receives inputs from the auditory midbrain, however, the exact origin can not be determined due to the large sizes of the injections. A cytoarchitecturally distinct ventromedial portion of Ov was also identified in zebra finches (Vates et al., 1996). Although its afferent input is unknown, this ventromedial portion of the Ov projects upon Field L2b, more comparable to SPO instead of the Ov proper in pigeons (Wild et al., 1993; see more discussion below). It is also worthy to note the separation of parallel pathways at the midbrain level is not as distinct in zebra finches as in chickens, pigeons, and owls. Axonal terminations from NA and NL display substantial overlap in the MLd in this species (Krützfeldt et al., 2010a).
Ov proper displays an inverted tonotopic map with the best frequencies decreasing ventrally, as compared to that recorded in MLd, in owls and starlings (Bigalke-Kunz et al., 1987; Häusler, 1988; Proctor and Konishi, 1997). Although no tonotopic map has been studied in chickens, the RI-recipient zone of MLd encodes sounds of low frequencies (Theurich et al., 1984) and projects upon the most ventral portion of the Ov proper (Ovvl). Consistently, the ventral portion of the MLd encodes sounds of high frequencies and projects upon a dorsal portion of the Ov proper (Ovdl). Such a projection pattern may provide the anatomical substrate for an inverted tonotopic map in the chicken Ov.
The segregation of multiple ascending pathways at the midbrain and thalamic levels has also been demonstrated in the mammalian auditory system. The ventral portion of the medial geniculate body (MGv) in the mammalian thalamus receives ascending auditory input from the central nucleus of the inferior colliculus (CNIC) in the midbrain and in turn projects upon the primary auditory cortex. In Mongolian gerbils, a mammalian species whose hearing range is similar to humans (Ryan 1976), the inferior colliculus is divided into two divisions, receiving inputs from different sets of cell groups in the brainstem (Cant and Benson, 2006). The two divisions of CNIC then project differentially to two non-overlapping regions of the MGv (Cant and Benson, 2007). This similarity between the birds and mammals suggests that the parallel organization of ascending auditory pathways at the subcortical levels may be a common feature in amniotic vertebrate brains.
Additional cell groups of the auditory thalamus
In addition to the Ov proper, a number of cell groups in the dorsal thalamus have been identified and considered as secondary auditory nuclei in the avian thalamus. In chickens, we identified two cell groups immediately adjacent to the Ov proper, the SPO and the cOv. Great caution should be taken when comparing these cell groups among avian species, as the same names have been given to distinct cell groups across studies.
One such confounding usage of the nomenclature is “Ov shell”. This name is generally referred to cell populations or groups surrounding the principle division of Ov. In zebra finches, “Ov shell” is defined as the neurons confined by the myelinated fiber capsule around Ov and TOv and are backfilled by injections of retrograde tracers into the Field L (Vates et al., 1996; Mello et al., 1998). This definition is consistent with the cOv in chickens identified in this study. Although not clearly defined, cells along the margin of the pigeon Ov proper are small (Wild et al., 1993) and contain CGRP (Brauth and Reiner, 1991), and may correspond to the chick cOv. In other studies, however, the term “Ov shell” is used to indicate collections of cell groups located separately from the Ov proper and SPO by cell-sparse fibers in bengalese finches (Zeng et al., 2004) and chickens (Zeng et al., 2008). The Ov shell in these studies shares a number of connective and biochemical features with the cell groups outside of the cOv in chickens. First, the Ov shell in bengalese finches projects upon the caudomedial hypothalamus and the caudal paleostriatum (Zeng et al., 2004). Double labeling studies in the chicken clarified that the neurons projecting to the hypothalamus are located outside of the cOv, instead of the cOv itself (see Fig. 26 in the current study). Second, heavy staining for met-enkephalin was found in a region medial to the Ov proper and cOv in chickens (unpublished observation), overlapped with the location of the medial portion of the Ov shell in bengalese finches (Zeng et al., 2004).
Comparison with the Ov shell identified in ring doves by Durand et al. (2001) is even more controversial. The ring dove Ov shell is comparable to the chicken cOv in CGRP immunoreactivity, however, it provides robust projections upon the caudomedial hypothalamus and the caudal paleostriatum but not the main body of the Field L. The authors reported anterogradely labeled axonal terminals in the Ov shell following injections into the interface region of medial MLd and ICo, overlapping with the CM of ICo. The distribution pattern of these labeling (Durand et al., 2001) resembles the location and shape of the chicken cOv (Fig. 2; the current study). These observations suggest that the Ov shell identified in ring doves (Durand et al., 2001) may be compared to both cOv and some cell groups outside of the Ov complex in chickens. These controversial observations indicate the complexity of the avian auditory thalamus and emphasize the importance of examining the distribution of these biomarkers and the connectivity by double labeling, other than relying on the general location of each cell group between cases and species.
Another confounding usage of nomenclature is “Ovm” and “SPO”. The SPO was first identified in pigeons as a ventrolaterally located cell group that receives input from MLd/ICo (Karten, 1967, 1968; Leibler, 1975). SPO and the Ov proper project respectively upon the Field L2a and L2b (Wild et al., 1993). A similar structure was identified in ring doves (Durand et al., 1992) and chickens (the current study). Our studies in the chicken further demonstrated that SPO and Ov proper receive intense midbrain inputs from the ICo and MLd, respectively. Whether SPO is also innervated by MLd at a lesser degree can not be determined in our preparations as our injections in MLd all involve a portion of ICo. However, the small sizes of terminal boutons in SPO repeatedly observed following injections into MLd/ICo suggests that SPO and the Ov proper may be innervated by different populations of afferent neurons/axons.
In contrast, no SPO was described in zebra finches and budgerigars. Instead, a distinct ventromedial cell group was identified as a target of MLd/ICo as well as a thalamic source to Field L2b (Brauth et al., 1987; Vates et al., 1996; named as Ovm). Similar connectivity suggests that the pigeon and chicken SPO may be comparable to this “Ovm” in songbirds. We noted, however, that the same name, Ovm, was used to refer to a medial cell group of the Ov shell outside of the fiber capsule and containing met-enkephalin immunoreactivity in chickens (Zeng et al., 2004). Caution should be taken when comparing specific Ov components across studies.
ICo projection to the auditory thalamus
Retrograde tracing studies identified at least four cell groups of ICo, including E, PC, S and CM, sending axonal projections to the dorsal thalamic areas containing the Ov complex. Anterograde tracing studies further demonstrated that the SPO and cOv, but not the Ov proper, are among the major thalamic targets of these cell groups, consistent with previous reports in ring doves (Durand et al., 2001). The functions of these ICo cell groups, as well as how their microcircuitry is connected to the microcircuitry of adjacent auditory divisions of MLd, are unknown. NA and NL do not innervate E, PC and S, although CM may contain some NA axonal terminals (Leibler, 1975; Conlee and Parks, 1986; Wang and Karten, 2010). E in chickens is sometimes compared to the external nucleus of the owl IC (ICx) due to their relative location to the ICC or MLd. The owl ICx receives auditory inputs from the ICC and then provides spatial auditory information to the optic tectum (Knudsen and Knudsen, 1983). Recently, an indirect projection from an area overlapping with the location of E upon the optic tectum was identified in chickens, supporting the idea that E may participate in a similar function as the ICx in auditory-visual integration (Niederleitner and Luksch, 2012; Niederleitner et al., 2017). A difference between the two cell groups, though, is that the owl ICx does not contain projecting neurons to the thalamus as demonstrated by injections into the Ov complex (Proctor and Konishi, 1997), arguing that their comparison requires further investigation.
An interesting finding in the chicken is that retrogradely labeled neurons were observed in PC and S bilaterally and in E and CM with an ipsilateral preference following injections into the Ov complex. However, anterograde studies along the medial border of the MLd that may overlap with PC and S displayed axonal labeling in the SPO and cOv mostly on the ipsilateral side. One interpretation of this seemingly controversy is that most neurons in PC and S project to the thalamus bilaterally, however, individual neurons/axons may form much more extensive termination ipsilaterally than contralaterally. Alternatively, PC and S may provide a strong contralateral projection to the cell groups adjacent to the Ov and thus involved in our thalamic injections. Injections that are more restricted to the Ov are required to clarify the nature of this projection.
Conclusion
The parallel organization of multiple pathways within the primary auditory ascending system (via MLd and Ov proper) at subcortical levels is likely typical in birds in general. Characterizing the organization and auditory features specifically encoded in each pathway at each level along the ascending system is essential for understanding auditory perception. How these pathways interact with each other (Takahashi et al., 1989; Wang and Karten, 2010) and with additional auditory-related pathways (via ICo, SPO, and cOv/shell) requires special attention. Further characterizations of interspecies variations at the subcortical levels are expected to facilitate a better understanding of brain evolution in birds.
Table 3.
Summary of the Ov subdivisions. +++, intense; ++, mediate; +, sparse; −, none; ?, unknown. Abbreviations: see table of abbreviations. $, A projection from ICo upon the Ov proper may exist, requiring further investigation.
| Ov proper |
SPO | SPOc | cOv | |||||
|---|---|---|---|---|---|---|---|---|
| Ovm | Ovdm | Ovdl | Ovvl | Ovvm | ||||
| Mean cell diameter (μm) | 16.4 | 17.7 | 19.3 | 19.8 | 19.7 | 16.0 | 14.9 | |
| Myelinated axons | + | ++ | +++; horizontal |
+ | +++; vertical |
++ | ++ | + |
| α8 subunit nAChR | − | − | − | − | +++; small cells |
− | − | − |
| Astrocyte density | +++ | +++ | + | +++ | + | +++ | + | +++ |
| parvalbumin neuropil | ++ | +++ | +++ | ++ | +++ | + | ++ | + |
| parvalbumin somata | − | ++ | ++ | − | ++ | − | − | − |
| CGRP somata | − | − | − | − | − | +++ | − | +++ |
| CCK somata | − | − | − | − | − | ++ | − | ++ |
| Midbrain inputs$ | NA-recipient MLd | RI-recipient MLd | NL-recipient MLd | ICo | ? | ICo | ||
Acknowledgments
Grant sponsors: National Institute of Neurological Disorders and Stroke [NS 24560]; National Institute of Mental Health [NH 60975]; National Institute on Deafness and Other Communication Disorders [DC 13074]
We extend our thanks to Agnieszka Brzozowska-Prechtl for histology assistance and Yong Liu for imaging assistance.
Role Of Authors
All authors had full access to all the data in the study and take responsibility for the integrity of the data and the accuracy of the data analysis. Study concept and design: Wang Y and Karten HJ. Acquisition and analysis of data: Wang Y and Zorio DAR. Manuscript preparation: Wang Y, Zorio DAR, and Karten HJ. Obtained funding: Wang Y and Karten HJ.
Table of Abbreviations used in the figures
- CM
caudomedial nucleus of the ICo
- CCK
cholecystokinin
- CGRP
calcitonin-gene-related peptide
- CNIC
central nucleus of the inferior colliculus
- cOV
circum-ovoidalis
- DSOD
dorsal supraoptic decussation
- E
external nucleus of the ICo
- GFAP
glial fibrillary acidic protein
- ICo
nucleus intercollicularis
- MGv
medial geniculate body
- MLd
nucleus mesencephalicus lateralis pars dorsalis
- NA
nucleus angularis
- nAChR
nicotinic acetylcholine receptor
- NL
nucleus laminaris
- NM
nucleus magnocellularis
- Ov
nucleus ovoidalis
- Ovm
Ov pars medialis
- Ovdl
Ov pars dorsolateralis
- Ovdm
Ov pars dorsomedialis
- Ovvl
Ov pars ventrolateralis
- Ovvm
Ov pars ventromedialis
- PC
paracentral toral nucleus
- PV
toral periventricular lamina
- RI
regio intermedius
- S
preisthmic superficial area
- SPO
nucleus semilunaris parovoidalis
- SPOc
SPO pars caudalis
- TOv
tractus ovoidalis
- TTS
tractus thalamostriaticus
- VII
facial nerve nucleus
- VSOD
ventral supraoptic decussation
Footnotes
Conflict Of Interest
The authors have no identified conflict of interest.
Data Accessibility
Literature Cited
- Amin N, Gill P, Theunissen FE. Role of the zebra finch auditory thalamus in generating complex representations for natural sounds. 2010. [DOI] [PMC free article] [PubMed] [Google Scholar]
- Arends JJ, Zeigler HP. Anatomical identification of an auditory pathway from a nucleus of the lateral lemniscal system to the frontal telencephalon (nucleus basalis) of the pigeon. Brain Res. 1986;398(2):375–81. doi: 10.1016/0006-8993(86)91499-x. [DOI] [PubMed] [Google Scholar]
- Berk ML, Smith SE, Karten HJ. Nucleus of the solitary tract and dorsal motor nucleus of the vagus nerve of the pigeon: localization of peptide and 5-hydroxytryptamine immunoreactive fibers. J Comp Neurol. 1993;338(4):521–48. doi: 10.1002/cne.903380404. [DOI] [PubMed] [Google Scholar]
- Bigalke-Kunz B, Rübsamen R, Dörrscheidt GJ. Tonotopic organization and functional characterization of the auditory thalamus in a songbird, the European starling. J Comp Physiol A. 1987;161(2):255–65. doi: 10.1007/BF00615245. [DOI] [PubMed] [Google Scholar]
- Brauth SE, McHale CM, Brasher CA, Dooling RJ. Auditory pathways in the budgerigar. I. Thalamo-telencephalic projections. Brain Behav Evol. 1987;30(3–4):174–99. doi: 10.1159/000118645. [DOI] [PubMed] [Google Scholar]
- Brauth SE, Reiner A. Calcitonin-gene related peptide is an evolutionarily conserved marker within the amniote thalamo-telencephalic auditory pathway. J Comp Neurol. 1991;313(2):227–39. doi: 10.1002/cne.903130204. [DOI] [PubMed] [Google Scholar]
- Britto LR, Hamassaki-Britto DE, Ferro ES, Keyser KT, Karten HJ, Lindstrom JM. Neurons of the chick brain and retina expressing both alpha-bungarotoxin-sensitive and alpha-bungarotoxin-insensitive nicotinic acetylcholine receptors: an immunohistochemical analysis. Brain Res. 1992;590(1–2):193–200. doi: 10.1016/0006-8993(92)91095-v. [DOI] [PubMed] [Google Scholar]
- Britto LR, Rogers SW, Hamassaki-Britto DE, Duvoisin RM. Nicotinic acetylcholine receptors in the ground squirrel retina: localization of the beta 4 subunit by immunohistochemistry and in situ hybridization. Vis Neurosci. 1994;11(3):569–77. doi: 10.1017/s0952523800002479. [DOI] [PubMed] [Google Scholar]
- Cant NB, Benson CG. Organization of the inferior colliculus of the gerbil (Meriones unguiculatus): differences in distribution of projections from the cochlear nuclei and the superior olivary complex. J Comp Neurol. 2006;495(5):511–28. doi: 10.1002/cne.20888. [DOI] [PMC free article] [PubMed] [Google Scholar]
- Cant NB, Benson CG. Multiple topographically organized projections connect the central nucleus of the inferior colliculus to the ventral division of the medial geniculate nucleus in the gerbil, Meriones unguiculatus. J Comp Neurol. 2007;503(3):432–53. doi: 10.1002/cne.21391. [DOI] [PubMed] [Google Scholar]
- Carr CE, Shah S, McColgan T, Ashida G, Kuokkanen PT, Brill S, Kempter R, Wagner H. Maps of interaural delay in the owl’s nucleus laminaris. J Neurophysiol. 2015;114(3):1862–73. doi: 10.1152/jn.00644.2015. [DOI] [PMC free article] [PubMed] [Google Scholar]
- Conlee JW, Parks TN. Origin of ascending auditory projections to the nucleus mesencephalicus lateralis pars dorsalis in the chicken. Brain Res. 1986;367(1–2):96–113. doi: 10.1016/0006-8993(86)91583-0. [DOI] [PubMed] [Google Scholar]
- Diekamp B, Margoliash D. Auditory responses in the nucleus ovoidalis are not so simple. Soc Neurosci Abstr. 1991;17:446. [Google Scholar]
- Durand SE, Tepper JM, Cheng MF. The shell region of the nucleus ovoidalis: a subdivision of the avian auditory thalamus. J Comp Neurol. 1992;323(4):495–518. doi: 10.1002/cne.903230404. [DOI] [PubMed] [Google Scholar]
- Durand SE, Brauth SE, Liang W. Calcitonin gene-related peptide immunoreactive cells and fibers in forebrain vocal and auditory nuclei of the budgerigar (Melopsittacus undulatus) Brain Behav Evol. 2001;58(2):61–79. doi: 10.1159/000047262. [DOI] [PubMed] [Google Scholar]
- Erichsen JT, Bingman VP, Krebs JR. The distribution of neuropeptides in the dorsomedial telencephalon of the pigeon (Columba livia): a basis for regional subdivisions. J Comp Neurol. 1991;314(3):478–92. doi: 10.1002/cne.903140306. [DOI] [PubMed] [Google Scholar]
- Fortune ES, Margoliash D. Thalamic input and cytoarchitecture of auditory neostriatum in zebra finch. Soc Neurosci Abstr. 1991;17:446. [Google Scholar]
- Gallyas F. Silver staining of myelin by means of physical development. Neurol Res. 1979;1(2):203–9. doi: 10.1080/01616412.1979.11739553. [DOI] [PubMed] [Google Scholar]
- Güntürkün O, Karten HJ. An immunocytochemical analysis of the lateral geniculate complex in the pigeon (Columba livia) J Comp Neurol. 1991;314(4):721–49. doi: 10.1002/cne.903140407. [DOI] [PubMed] [Google Scholar]
- Häusler U. Topography of the thalamotelencephalic projections in the auditory system of a songbird. In: Syka J, Masterton RB, editors. Auditory Pathway: Structure and Function. New York: Plenum Press; 1988. pp. 197–202. [Google Scholar]
- Iñiguez C, Gayoso MJ, Carreres J. A versatile and simple method for staining nervous tissue using Giemsa dye. J Neurosci Methods. 1985;13(1):77–86. doi: 10.1016/0165-0270(85)90045-7. [DOI] [PubMed] [Google Scholar]
- Karten HJ. The organization of the ascending auditory pathway in the pigeon (Columba livia). I. Diencephalic projections of the inferior colliculus (nucleus mesencephali lateralis, pars dorsalis) Brain Res. 1967;6(3):409–27. doi: 10.1016/0006-8993(67)90055-8. [DOI] [PubMed] [Google Scholar]
- Karten HJ. The ascending auditory pathway in the pigeon (Columba livia). II. Telencephalic projections of the nucleus ovoidalis thalami. Brain Res. 1968;11(1):134–53. doi: 10.1016/0006-8993(68)90078-4. [DOI] [PubMed] [Google Scholar]
- Katz DM, Karten HJ. Subnuclear organization of the dorsal motor nucleus of the vagus nerve in the pigeon, Columbia livia. J Comp Neurol. 1983;217(1):31–46. doi: 10.1002/cne.902170104. [DOI] [PubMed] [Google Scholar]
- Keyser KT, Britto LR, Schoepfer R, Whiting P, Cooper J, Conroy W, Brozozowska-Prechtl A, Karten HJ, Lindstrom J. Three subtypes of alpha-bungarotoxin-sensitive nicotinic acetylcholine receptors are expressed in chick retina. J Neurosci. 1993;(2):442–54. doi: 10.1523/JNEUROSCI.13-02-00442.1993. [DOI] [PMC free article] [PubMed] [Google Scholar]
- Knudsen EI, Knudsen PF. Space-mapped auditory projections from the inferior colliculus to the optic tectum in the barn owl (Tyto alba) J Comp Neurol. 1983;218:187–196. doi: 10.1002/cne.902180206. [DOI] [PubMed] [Google Scholar]
- Krützfeldt NO, Logerot P, Kubke MF, Wild JM. Connections of the auditory brainstem in a songbird, Taeniopygia guttata. I. Projections of nucleus angularis and nucleus laminaris to the auditory torus. J Comp Neurol. 2010a;518(11):2109–34. doi: 10.1002/cne.22334. [DOI] [PMC free article] [PubMed] [Google Scholar]
- Krützfeldt NO, Logerot P, Kubke MF, Wild JM. Connections of the auditory brainstem in a songbird, Taeniopygia guttata. II. Projections of nucleus angularis and nucleus laminaris to the superior olive and lateral lemniscal nuclei. J Comp Neurol. 2010b;518(11):2135–48. doi: 10.1002/cne.22324. [DOI] [PMC free article] [PubMed] [Google Scholar]
- Lanuza E, Davies DC, Landete JM, Novejarque A, Martínez-García F. Distribution of CGRP-like immunoreactivity in the chick and quail brain. J Comp Neurol. 2000;421(4):515–32. doi: 10.1002/(sici)1096-9861(20000612)421:4<515::aid-cne4>3.0.co;2-6. [DOI] [PubMed] [Google Scholar]
- Leibler LM. Monoaural and binaural pathways in the ascending auditory system of the pigeon PhD thesis. Massachusetts Institute of Technology; Cambridge, MA: 1975. [Google Scholar]
- Mello CV, Vates GE, Okuhata S, Nottebohm F. Descending auditory pathways in the adult male zebra finch (Taeniopygia guttata) J Comp Neurol. 1998;395(2):137–60. [PubMed] [Google Scholar]
- Metzger M, Jiang S, Braun K. Organization of the dorsocaudal neostriatal complex: a retrograde and anterograde tracing study in the domestic chick with special emphasis on pathways relevant to imprinting. J Comp Neurol. 1998;395(3):380–404. [PubMed] [Google Scholar]
- Moiseff A, Konishi M. Binaural characteristics of units in the owl’s brainstem auditory pathway: precursors of restricted spatial receptive fields. J Neurosci. 1983;(12):2553–62. doi: 10.1523/JNEUROSCI.03-12-02553.1983. [DOI] [PMC free article] [PubMed] [Google Scholar]
- Niederleitner B, Luksch H. Neuronal morphology in subdivisions of the inferior colliculus of chicken (Gallus gallus) J Chem Neuroanat. 2012;44(1):24–33. doi: 10.1016/j.jchemneu.2012.03.004. [DOI] [PubMed] [Google Scholar]
- Niederleitner B, Gutierrez-Ibanez C, Krabichler Q, Weigel S, Luksch H. A novel relay nucleus between the inferior colliculus and the optic tectum in the chicken (Gallus gallus) J Comp Neurol. 2017;525(3):513–534. doi: 10.1002/cne.24082. [DOI] [PubMed] [Google Scholar]
- Ohmori H. Neuronal specializations for the processing of interaural difference cues in the chick. Front Neural Circuits. 2014;8:47. doi: 10.3389/fncir.2014.00047. [DOI] [PMC free article] [PubMed] [Google Scholar]
- Panicker H, Wadhwa S, Roy TS. Effect of prenatal sound stimulation on medio-rostral neostriatum/hyperstriatum ventrale region of chick forebrain: a morphometric and immunohistochemical study. J Chem Neuroanat. 2002;24(2):127–35. doi: 10.1016/s0891-0618(02)00041-8. [DOI] [PubMed] [Google Scholar]
- Pfeiffer CP, Britto LR. Distribution of calcium-binding proteins in the chick visual system. Braz J Med Biol Res. 1997;30(11):1315–8. doi: 10.1590/s0100-879x1997001100009. [DOI] [PubMed] [Google Scholar]
- Prather JF. Auditory signal processing in communication: perception and performance of vocal sounds. Hear Res. 2013;305:144–55. doi: 10.1016/j.heares.2013.06.007. [DOI] [PMC free article] [PubMed] [Google Scholar]
- Proctor L, Konishi M. Representation of sound localization cues in the audiotry thalamus of the barn owl. Proc Natl Acad Sci USA. 1997;94:10421–1042. doi: 10.1073/pnas.94.19.10421. [DOI] [PMC free article] [PubMed] [Google Scholar]
- Puelles L, Robles C, Martínez-de-la-Torre M, Martínez S. New subdivision schema for the avian torus semicircularis: neurochemical maps in the chick. J Comp Neurol. 1994;340(1):98–125. doi: 10.1002/cne.903400108. [DOI] [PubMed] [Google Scholar]
- Ryan A. Hearing sensitivity of the mongolian gerbil, Meriones unguiculatis. J Acoust Soc Am. 1976;59(5):1222–6. doi: 10.1121/1.380961. [DOI] [PubMed] [Google Scholar]
- Shimizu T, Karten HJ. Immunohistochemical analysis of the visual wulst of the pigeon (Columba livia) J Comp Neurol. 1990;300(3):346–69. doi: 10.1002/cne.903000307. [DOI] [PubMed] [Google Scholar]
- Schoepfer R, Conroy WG, Whiting P, Gore M, Lindstrom J. Brain alpha-bungarotoxin binding protein cDNAs and MAbs reveal subtypes of this branch of the ligand-gated ion channel gene superfamily. Neuron. 1990;5(1):35–48. doi: 10.1016/0896-6273(90)90031-a. [DOI] [PubMed] [Google Scholar]
- Sullivan WE, Konishi M. Segregation of stimulus phase and intensity coding in the cochlear nucleus of the barn owl. J Neurosci. 1984;(7):1787–99. doi: 10.1523/JNEUROSCI.04-07-01787.1984. [DOI] [PMC free article] [PubMed] [Google Scholar]
- Takahashi T, Moiseff A, Konishi M. Time and intensity cues are processed independently in the auditory system of the owl. J Neurosci. 1984;4(7):1781–6. doi: 10.1523/JNEUROSCI.04-07-01781.1984. [DOI] [PMC free article] [PubMed] [Google Scholar]
- Takahashi TT, Konishi M. Projections of the cochlear nuclei and nucleus laminaris to the inferior colliculus of the barn owl. J Comp Neurol. 1988;274(2):190–211. doi: 10.1002/cne.902740206. [DOI] [PubMed] [Google Scholar]
- Takahashi TT, Wagner H, Konishi M. Role of commissural projections in the representation of bilateral auditory space in the barn owl’s inferior colliculus. J Comp Neurol. 1989;281:545–554. doi: 10.1002/cne.902810405. [DOI] [PubMed] [Google Scholar]
- Theurich M, Langner G, Scheich H. Infrasound responses in the midbrain of the guinea fowl. Neurosci Lett. 1984;49(1–2):81–6. doi: 10.1016/0304-3940(84)90140-x. [DOI] [PubMed] [Google Scholar]
- Torrealba F. Calcitonin gene-related peptide immunoreactivity in the nucleus of the tractus solitarius and the carotid receptors of the cat originates from peripheral afferents. Neuroscience. 1992;47(1):165–73. doi: 10.1016/0306-4522(92)90129-p. [DOI] [PubMed] [Google Scholar]
- Vates GE, Broome BM, Mello CV, Nottebohm F. Auditory pathways of caudal telencephalon and their relation to the song system of adult male zebra finches. J Comp Neurol. 1996;366(4):613–42. doi: 10.1002/(SICI)1096-9861(19960318)366:4<613::AID-CNE5>3.0.CO;2-7. [DOI] [PubMed] [Google Scholar]
- Wang Y, Luksch H, Brecha NC, Karten HJ. Columnar projections from the cholinergic nucleus isthmi to the optic tectum in chicks (Gallus gallus): a possible substrate for synchronizing tectal channels. J Comp Neurol. 2006;494:7–35. doi: 10.1002/cne.20821. [DOI] [PubMed] [Google Scholar]
- Wang Y, Karten HJ. Three subdivisions of the auditory midbrain in chicks (Gallus gallus) identified by their afferent and commissural projections. J Comp Neurol. 2010;518(8):1199–219. doi: 10.1002/cne.22269. [DOI] [PMC free article] [PubMed] [Google Scholar]
- Wang Y, Brzozowska-Prechtl A, Karten HJ. Laminar and columnar auditory cortex in avian brain. Proc Natl Acad Sci USA. 2010;107:12676–12681. doi: 10.1073/pnas.1006645107. [DOI] [PMC free article] [PubMed] [Google Scholar]
- Whiting PJ, Liu R, Morley BJ, Lindstrom JM. Structurally different neuronal nicotinic acetylcholine receptor subtypes purified and characterized using monoclonal antibodies. J Neurosci. 1987;7:4005–4016. doi: 10.1523/JNEUROSCI.07-12-04005.1987. [DOI] [PMC free article] [PubMed] [Google Scholar]
- Whiting PJ, Schoepfer R, Conroy WG, Gore MJ, Keyser KT, Shimasaki S, Esch F, Lindstrom JM. Expression of nicotinic acetylcholine receptor subtypes in brain and retina. Brain Res Mol Brain Res. 1991;10:61–70. doi: 10.1016/0169-328x(91)90057-5. [DOI] [PubMed] [Google Scholar]
- Wild JM. Nuclei of the lateral lemniscus project directly to the thalamic auditory nuclei in the pigeon. Brain Res. 1987;408(1–2):303–7. doi: 10.1016/0006-8993(87)90393-3. [DOI] [PubMed] [Google Scholar]
- Wild JM, Karten HJ, Frost BJ. Connections of the auditory forebrain in the pigeon (Columba livia) J Comp Neurol. 1993;337(1):32–62. doi: 10.1002/cne.903370103. [DOI] [PubMed] [Google Scholar]
- Wild JM. Convergence of somatosensory and auditory projections in the avian torus semicircularis, including the central auditory nucleus. J Comp Neurol. 1995;358(4):465–86. doi: 10.1002/cne.903580402. [DOI] [PubMed] [Google Scholar]
- Zeng S, Zhang X, Peng W, Zuo M. Immunohistochemistry and neural connectivity of the Ov shell in the songbird and their evolutionary implications. J Comp Neurol. 2004;470:192–209. doi: 10.1002/cne.11042. [DOI] [PubMed] [Google Scholar]
- Zeng S, Lin Y, Yang L, Zhang X, Zuo M. Comparative analysis of neurogenesis between the core and shell regions of auditory areas in the chick (Gallus gallus domesticus) Brain Res. 2008;1216:24–37. doi: 10.1016/j.brainres.2008.04.012. [DOI] [PubMed] [Google Scholar]


