
Figure 10.
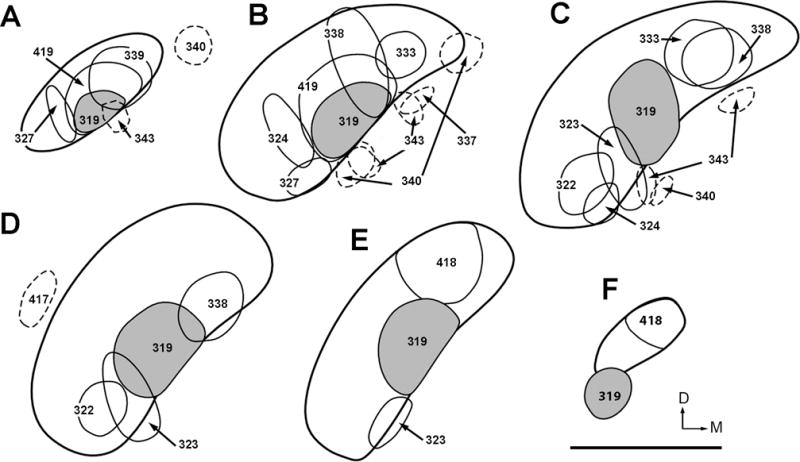
Line drawings illustrating the injection sites of CTB within MLd (solid lines) and the adjacent ICo (dashed lines). The drawings are arranged from caudal (A) to rostral (F). Case numbers are indicated. Case 319 (solid grey) involves the NL-recipient zone of MLd. Case 340 and 343 received two injections each. The dorsal is up and the right is medial. Scale bar = 1 mm.