
Figure 12.
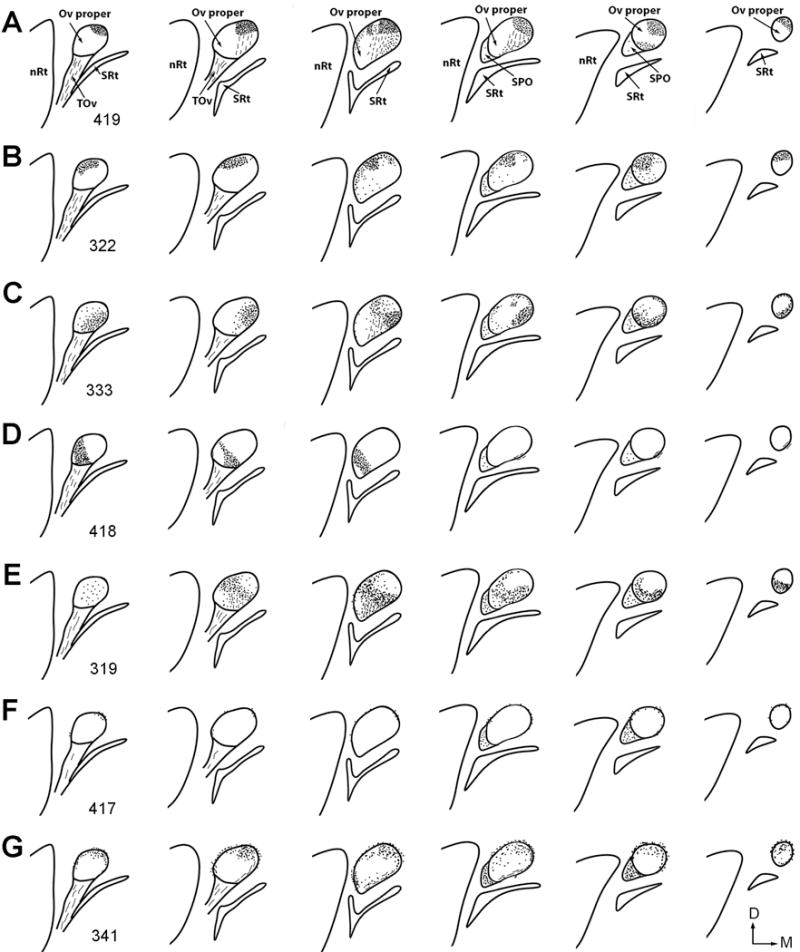
Line drawings of differential distribution of anterogradely labeled axons in the Ov complex following CTB injections into the MLd and ICo. Injection sites are illustrated in Figure 10. Dots and dashed lines indicate labeled terminals and axons, respectively. For each case, drawings are arranged from caudal (lateral) to rostral (medial). Case number is indicated in the first drawing of each case. Microphotographs of selected cases are illustrated in Figures 13–18.