
Figure 15.
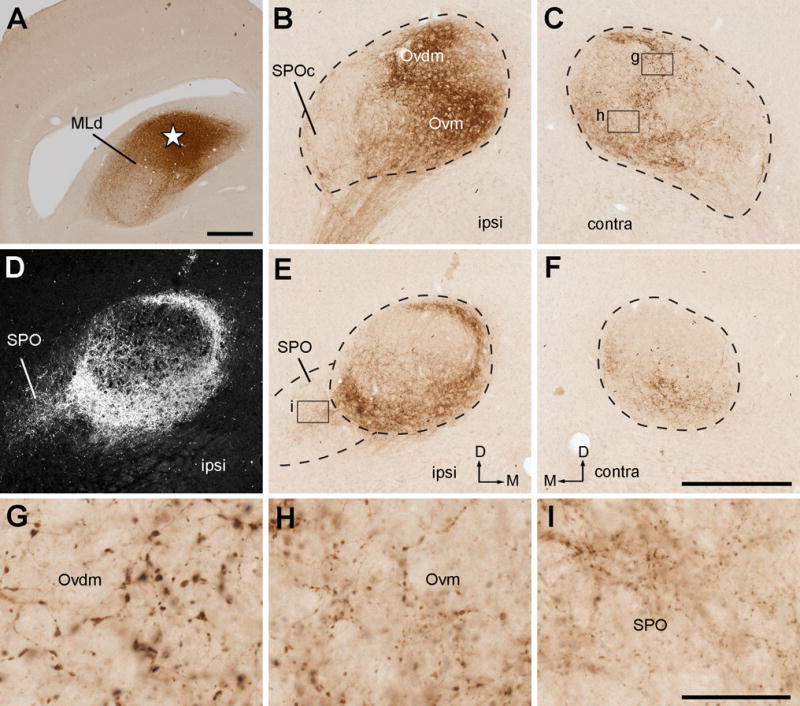
Photomicrographs of anterogradely labeled terminals following CTB injection into the dorsal MLd (NA-recipient zone). All images were taken from case 333. A, The injection site in the MLd (star). B–C, Anterogradely labeled terminals in the ipsilateral (B) and contralateral (C) Ov at the intermediate level. The highest density of labeled terminals is located in Ovm. D, Dark-field image of the section in E, showing the labeling in SPO in addition to the Ov proper. E–F, Anterogradely labeled terminals in the ipsilateral (E) and contralateral (F) Ov at the more rostral level. G–I, Closer views of the boxes in B and E. Labeled terminal boutons are larger in Ovdm (G) than in Ovm (H) and SPO (I). Dashed lines indicate the approximate borders of Ov and SPO. The dorsal is up. The medial is right in A–B, D–E and left in C–F. Scale bars = 500 μm in A, 500 μm in F (applies to B–F); 50 μm in I (applies to G–I).