
Figure 16.
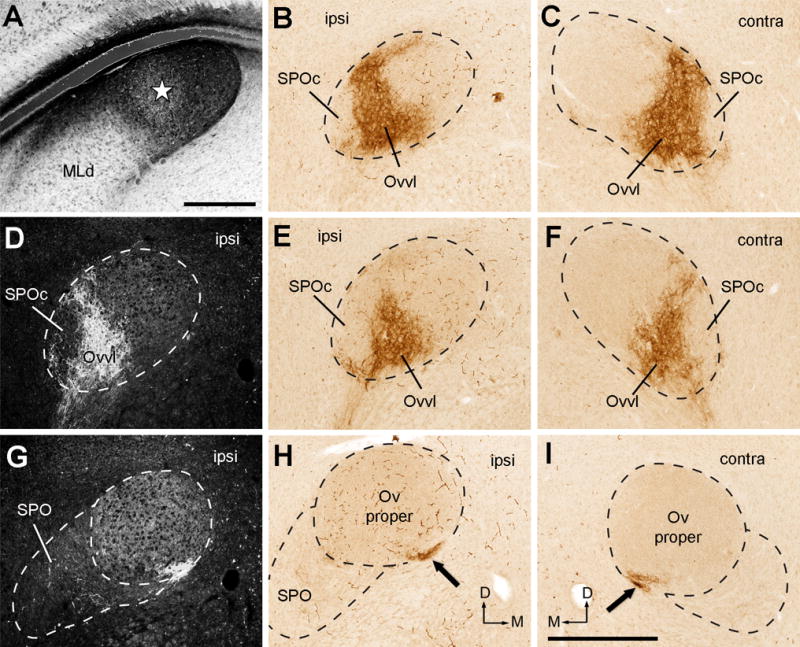
Photomicrographs of anterogradely labeled terminals following CTB injection into the rostromedial MLd (RI-recipient zone). All images were taken from case 418. A, Dark-field image showing the injection site in the MLd (star). B–C, Anterogradely labeled terminals in the ipsilateral (B) and contralateral (C) Ov at the intermediate level. Labeled axonal terminals are restricted in Ovvl on either side. D–F, Dark-field (D) and bright-field images (E–F) of anterogradely labeled terminals in the ipsilateral (D–E) and contralateral (F) Ov at the more rostral level. G–I, Dark-field (G) and bright-field images (H–I) of anterogradely labeled terminals in the ipsilateral (G–H) and contralateral (I) Ov at the most rostral level. Arrows indicate labeled axon bundles along the ventral edge of Ov. Very little staining was found in other Ov subdivisions and SPOc/SPO. Dashed lines indicate the approximate borders of Ov and SPO. The dorsal is up. The medial is right in the first two columns (A–B, D–E, G–H) and left in the far right column (C, F, I). Scale bars = 500 μm in A, 500 μm in I (applies to B–I).