
Figure 17.
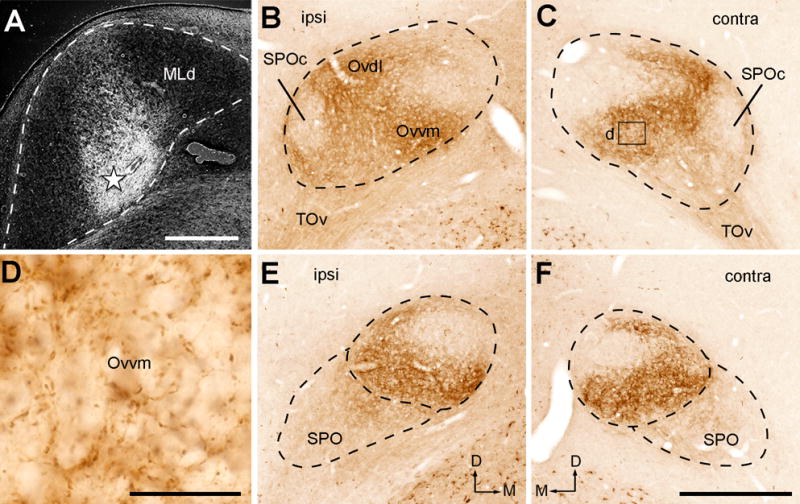
Photomicrographs of anterogradely labeled terminals following CTB injection into the NL-recipient zone of MLd. All images were taken from case 319. A, Dark-field image showing the injection site in MLd (star). B–C, Anterogradely labeled terminals in the ipsilateral (B) and contralateral (C) Ov at the intermediate level. Labeled axonal terminals are most densely distributed in Ovvm. D, Closer view of the box in C. E–F, Anterogradely labeled terminals in the ipsilateral (E) and contralateral (F) Ov at the more rostral level. Dashed lines indicate the approximate borders of Ov and SPO. The dorsal is up. The medial is right in A, B, E and left in C and F. Scale bars = 500 μm in A, 50 μm in D, 500 μm in F (applies to B–C, E–F).