
Figure 2.
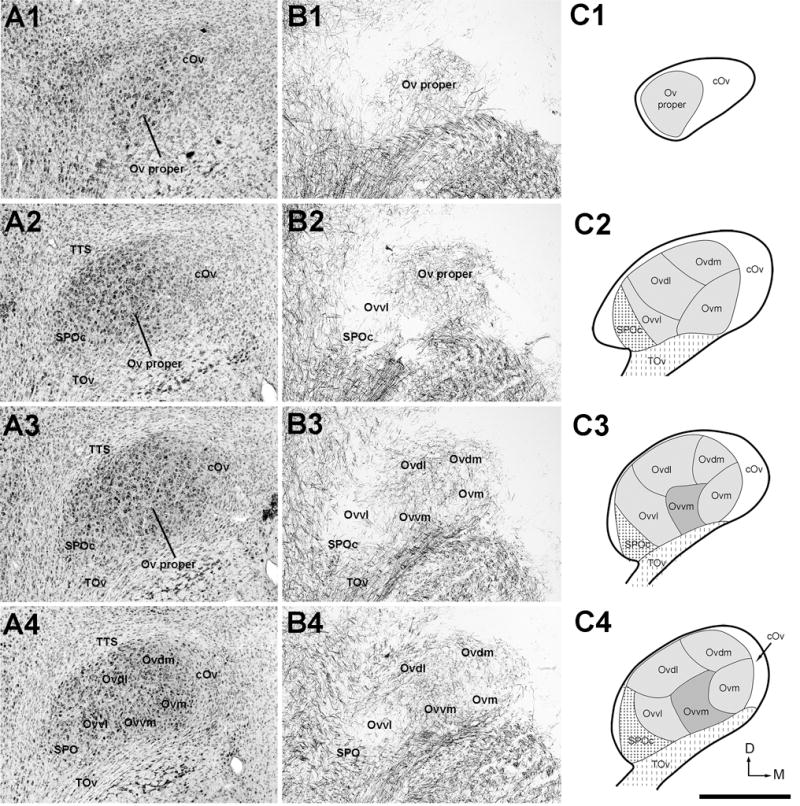
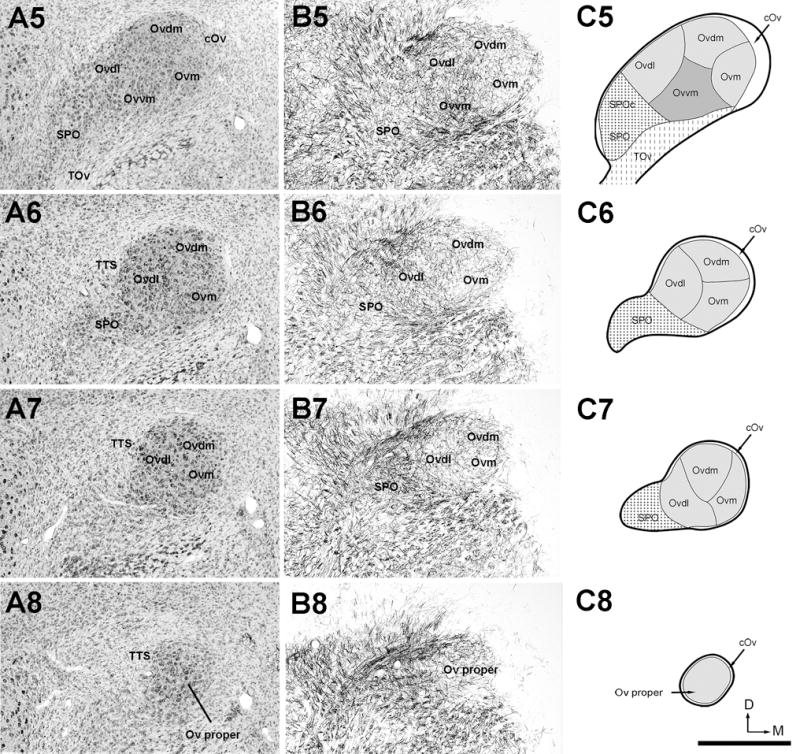
The organization of the Ov complex. A, Series of evenly spaced images taken from Nissl-stained sections through the Ov complex from caudal (A1) to rostral (A8). The images were taken from every third sections of 30 μm thick, so that the distance between images are 90 μm. B, Series of images taken from myelin-stained sections of the same animal from caudal (B1) to rostral (B8). Each image in B was from an adjacent section to the corresponding image in A. All images are in the coronal plane. Dorsal is up and lateral is left. A4 and B4 are shown with a higher magnification in Figure 3. C, Schematic drawings of identified subregions of the Ov complex. Drawings from C1 to C8 are arranged from caudal to rostral, corresponding to the levels illustrated in the images in A and B. The Ov complex includes three major regions, the Ov proper comprised of five neuronal clusters, SPO/SPOc, and cOv. The dorsal is up and the right is medial. Scale bar = 500 μm.