
Figure 20.
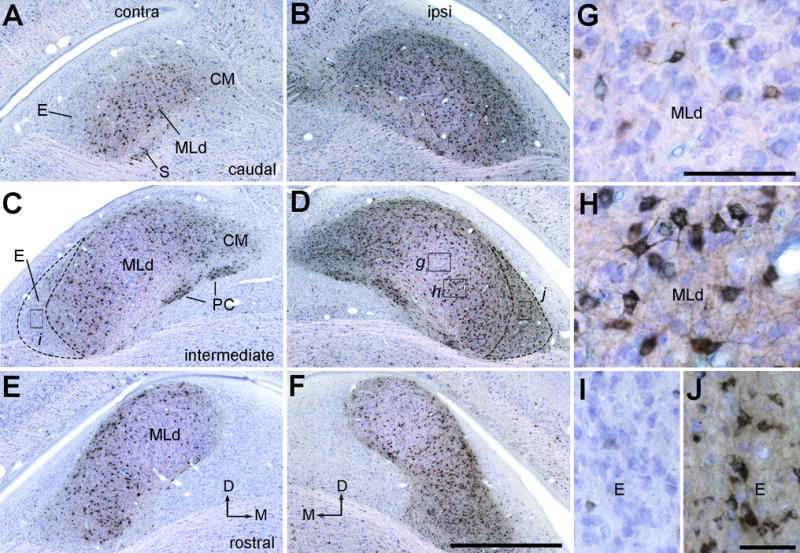
Photomicrographs of retrogradely labeled neurons in MLd and ICo following CTB injection into the Ov complex (case 435). Sections were counterstained with Giemsa so that CTB positive and negative neurons are in black and blue, respectively. A–B, Labeled neurons in the contralateral (A) and ipsilateral (B) MLd at the caudal level. C–D, Labeled neurons in the contralateral (C) and ipsilateral (D) MLd at the intermediate level. E–F, Labeled neurons in the contralateral (E) and ipsilateral (F) MLd at the rostral level. The dorsal is up. The medial is right in A, C, E, and left in B, D, F. G–J, Closer views of the boxes in C and D. Less neurons were labeled in the central (G) and rostromedial MLd than the remaining areas of MLd (H). The external nucleus of ICo contains a notably higher density of labeled neurons ipsilaterally (J) than contralaterally (I). Scale bars = 2 mm in F (applies to A–F), 500 μm in G (applies to G–H), 50 μm in J (applies to I–J).