
Figure 21.
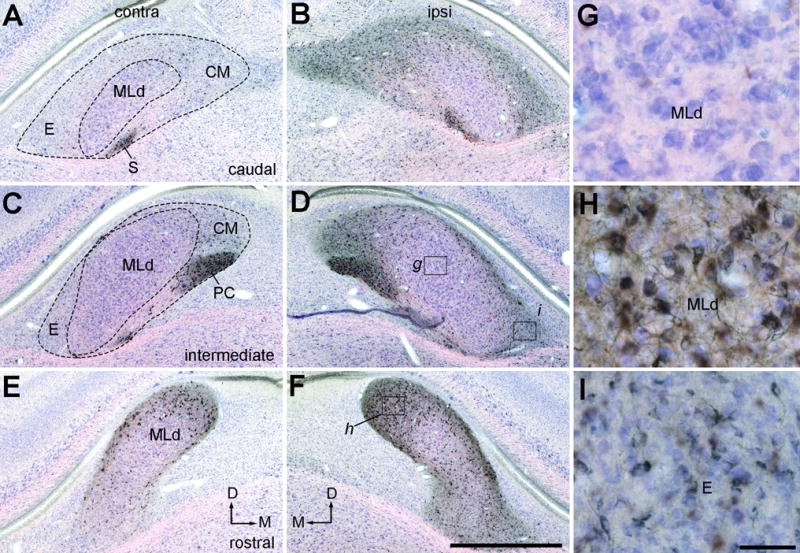
Photomicrographs of retrogradely labeled neurons in MLd and ICo following CTB injection into the Ov complex (case 479). Sections were counterstained with Giemsa so that CTB positive and negative neurons are in black and blue, respectively. A–B, Labeled neurons in the contralateral (A) and ipsilateral (B) MLd at the caudal level. C–D, Labeled neurons in the contralateral (C) and ipsilateral (D) MLd at the intermediate level. E–F, Labeled neurons in the contralateral (E) and ipsilateral (F) MLd at the rostral level. The dorsal is up and the right is medial in A, C, E. The dorsal is up and the left is medial in B, D, F. G–H, Closer views of the boxes in D and F showing labeled neurons in the rostromedial (H), but not other divisions (G), of MLd. I,. Closer views of the box in D showing labeled cells in the ipsilateral external nucleus of ICo. Scale bars = 2 mm in F (applies to A–F), 50 μm in I (applies to G–I).