
Figure 3.
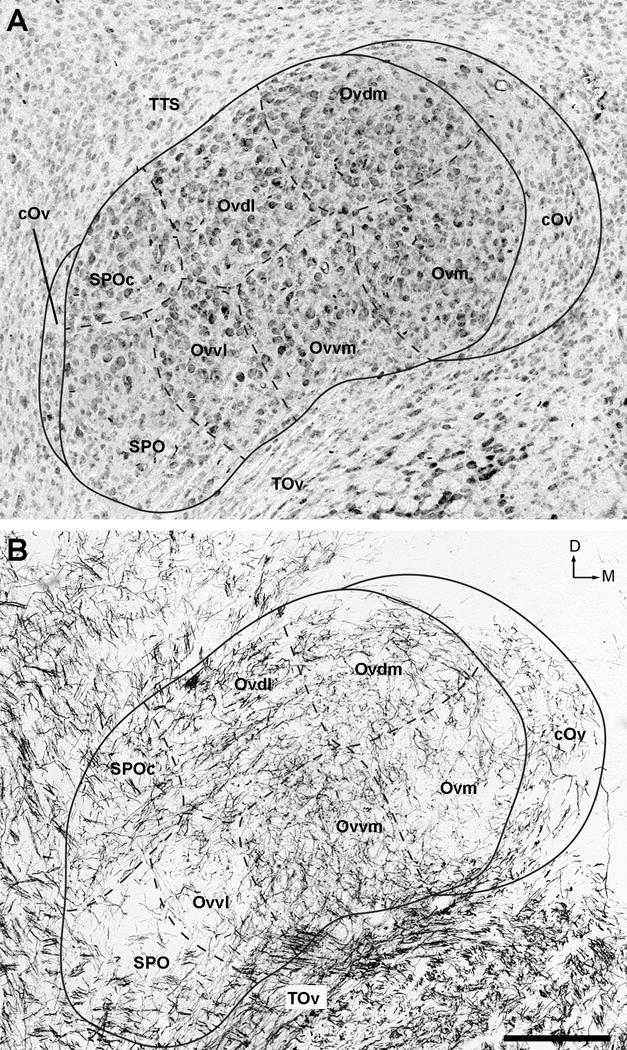
High-magnification images of the Ov complex in Nissl (A) and myelin-stained (B) sections. Solid and dashed lines outline approximate borders between the Ov subdivisions. Note varied cell size as well as different density and orientation of myelinated fibers between these subdivisions. The dorsal is up and the right is medial. Scale bar = 200 μm.