
Figure 4.
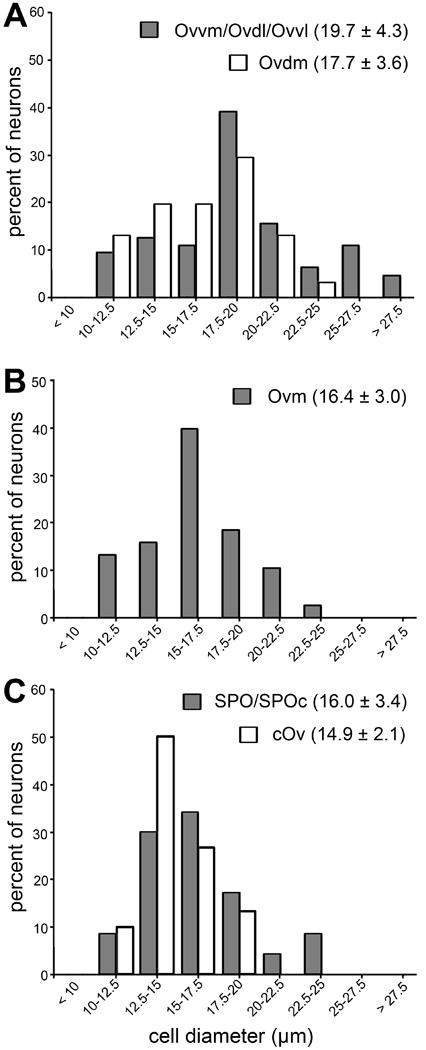
Frequency histogram of neuronal cell diameter in Ov subdivisions. Cell diameter was measured as described in Methods and Materials. Cells in Ovvm, Ovdl, and Ovvl do not differ significantly from each other in cell diameter, and are grouped for clarity. Similarly, SPO and SPOc are grouped. Each data point represents the percentage of neurons with the cell diameter within the assigned value of the bin. The peak of individual histograms indicates the most frequent range of cell diameter for each subdivision/group. The mean and standard deviation of cell diameter among all measured neurons in each group is indicated for each histogram.