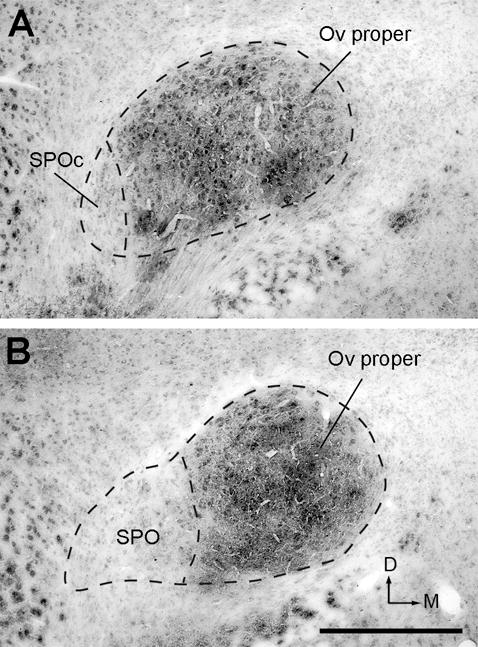
Figure 5.

Acetylcholinesterase activity in the Ov complex. Image in A was taken from a section more caudal than that in B. Note light staining in SPO and SPOc as compared to dark staining in the Ov proper. The dorsal is up and the right is medial. Scale bar = 500 μm.
