
Figure 6.
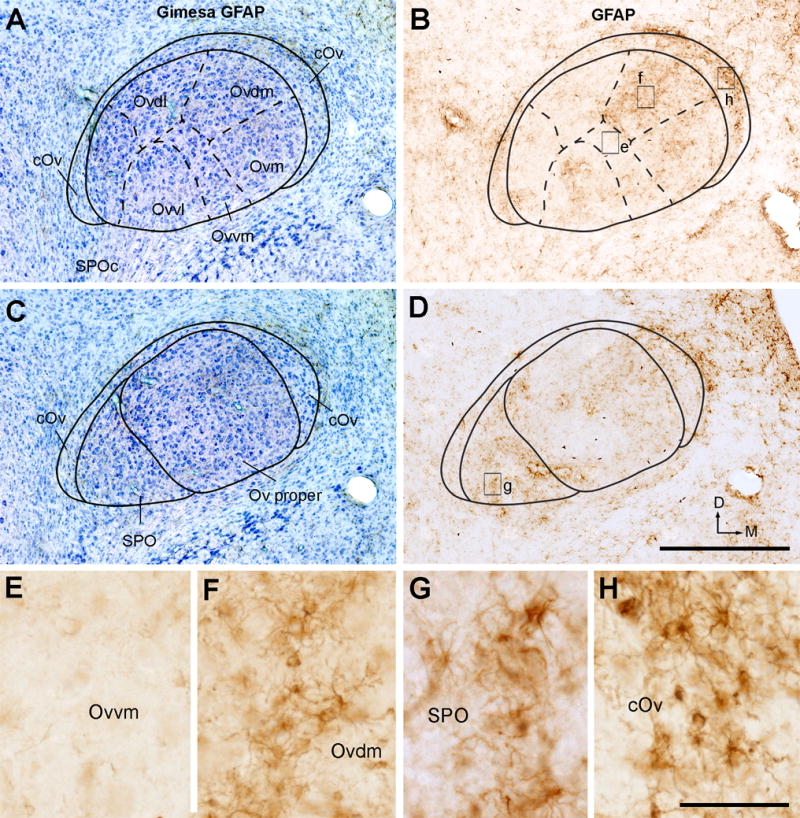
Immunoreactivities for GFAP. A, The Ov at the intermediate level from a section stained for GFAP immunoreactivity (black) and Giemsa counterstain (blue). B, GFAP immunoreactivity only. The image was taken from an adjacent section to A. The Ov subdivisions were outlined based on Giemsa stain (solid and dashed lines). C, The Ov at the rostral level stained for GFAP immunoreactivity (black) and Giemsa counterstain (blue). D, GFAP immunoreactivity only. The image was taken from an adjacent section to C. The Ov subdivisions were outlined based on Giemsa stain (solid and dashed lines). E–H, Closer views of the boxes in B and D. Note darkly labeled glial cells in Ovdm (F), SPO (G), and cOv (H), but not in Ovvm (E). The dorsal is up and the right is medial. Scale bar = 500 μm in D (applies to A–D), 50 μm in H (applies to E–H).