
Figure 7.
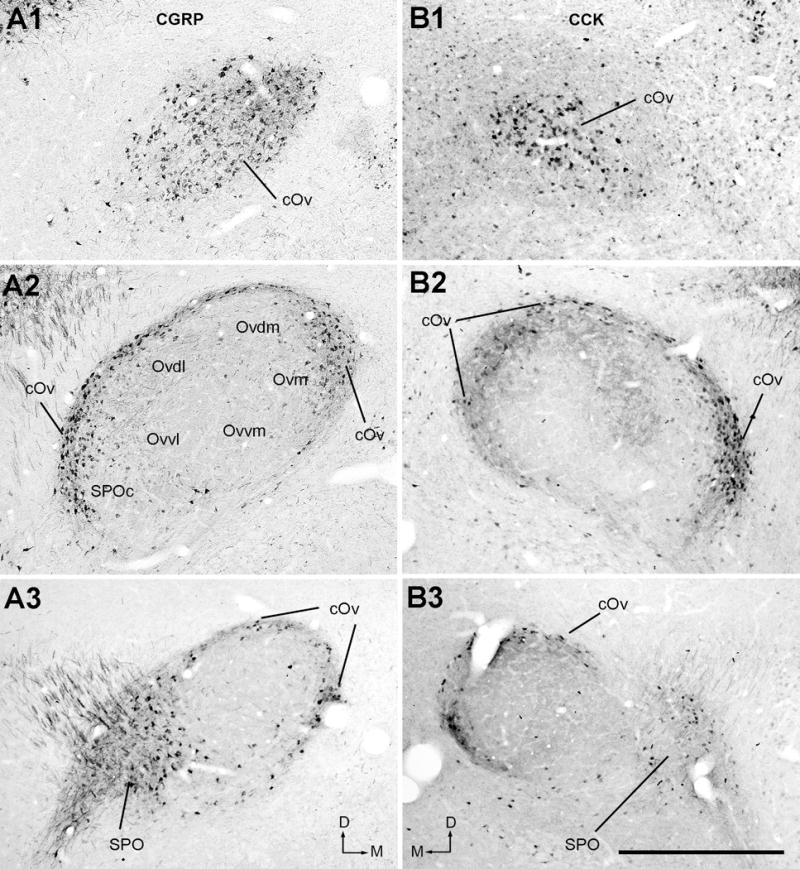
Immunoreactivities for CGRP (A) and CCK (B). Photos were taken from the caudal (A1 and B1), intermediate (A2 and B2) and rostral (A3 and B3) levels of the Ov complex. Note darkly labeled neurons in the cOv and SPO/SPOc. The dorsal is up and the right is medial in A. The dorsal is up and the left is medial in B. Scale bar = 500 μm.