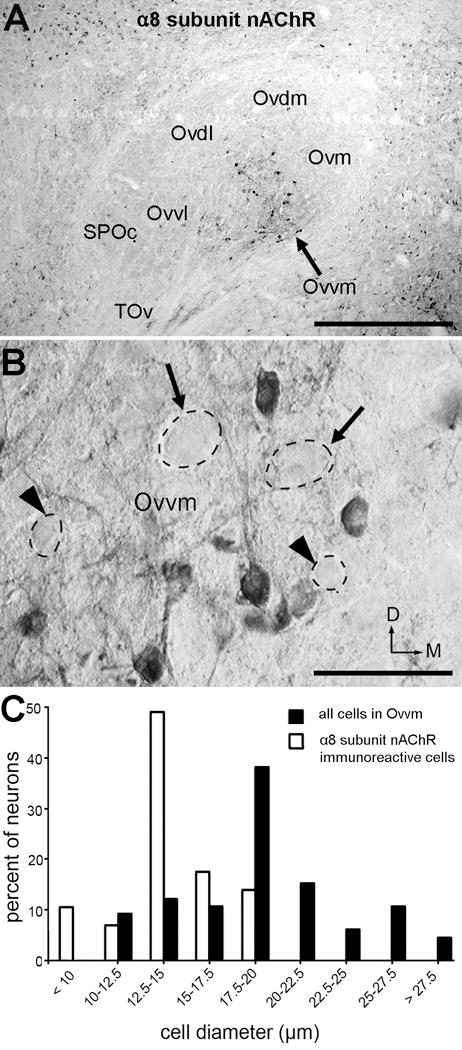
Figure 9.

Immunoreactivity for α8 subunit nAChR. A, Bright-field image through the middle of the Ov. Note the majority of immunoreactive neurons are located in the Ovvm. B, Normarski image of the Ovvm at a higher magnification. Arrows and arrowheads indicate unstained large and small neurons, respectively. C, Frequency histogram of cell diameter of immunoreactive neurons (dashed lines) in Ovvm. The frequency histogram for all neurons in Ovvm measured from Nissl-stained sections (solid line) is shown as a comparison. The dorsal is up and the right is medial. Scale bar = 500 μm in A; 50 μm in B.
