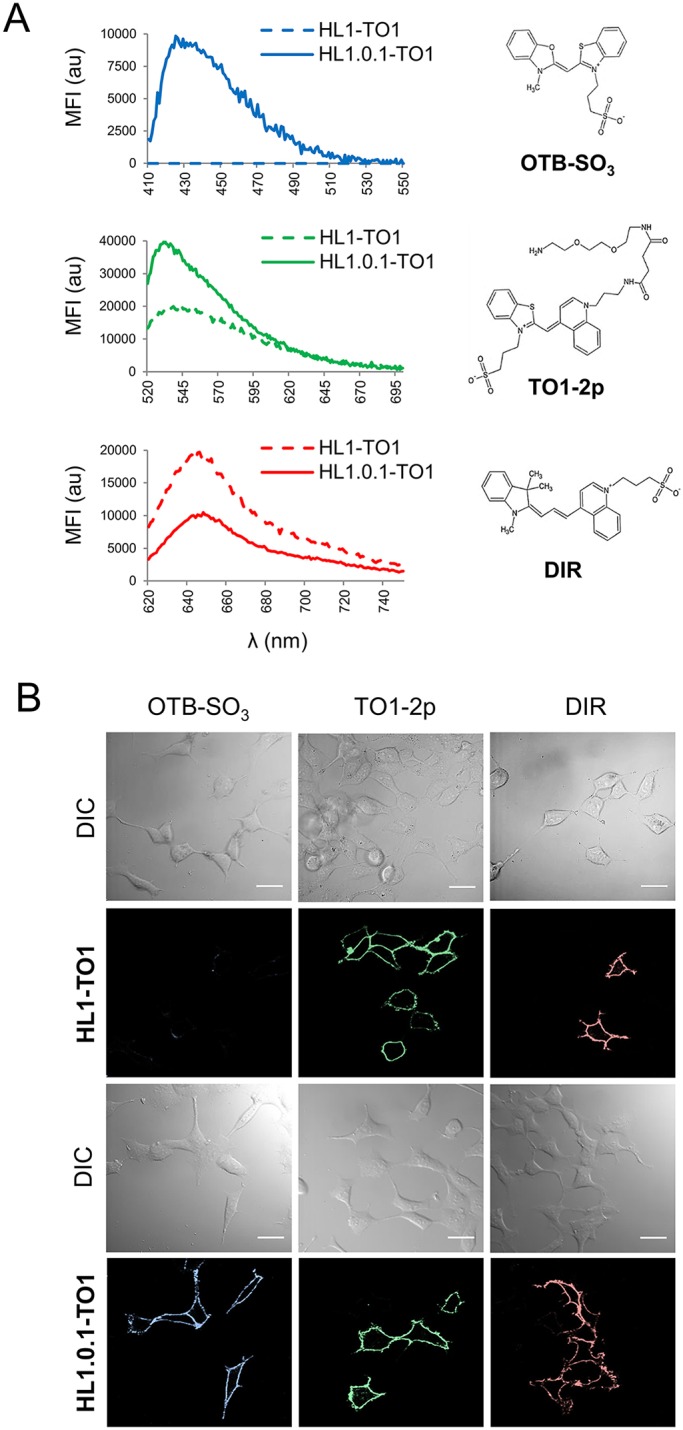
Fig. 2.

Comparison of HL1-TO1 or HL1.0.1-TO1 proteins expressed at the surface of live cells and screened for activation of different fluorogens. (A) Fluorescence emission spectra of surface displayed HL1-TO1 versus HL1.0.1-TO1 on yeast cells in presence of different fluorogens. Comparisons assessments were performed at 2- or 5-fold the Kd values of each fluorogen for its cognate scFv (see Table 1). (B) Micrographs of live mammalian cells expressing HL1.0.1-TO1 fused to adrenoreceptor β2 (ADRB2) at the surface. Cells were imaged in the presence of 100 nM of each fluorogen independently. Scale bars: 30 μm.
