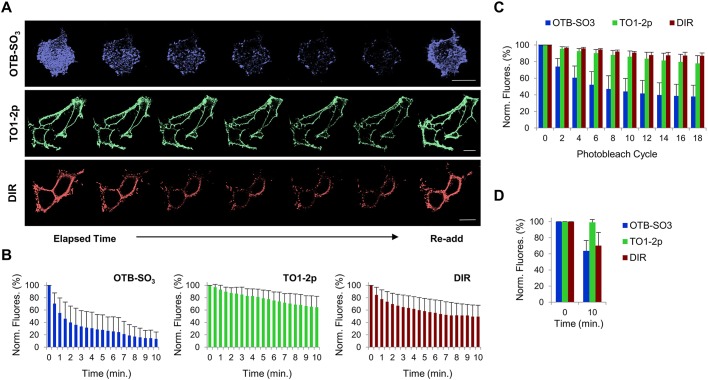
Fig. 3.
Assessing fluorescence signal loss at the surface of live mammalian cells after fluorogen removal from the cellular medium. All analyses were performed using cells expressing HL1.0.1-TO1 fused to ADRB2 at the cell surface. (A) Time-lapse micrographs from cells initially labeled with fluorogen, then washed and imaged for 10 min; at the last time point fluorogen was re-added. Each fluorogen time-series micrograph represents multiples images over time. Scale bar: 15 μm. (B) Bar graph summary of fluorescence intensities from fluorogen removal time-lapse images (n=5). (C) Bar graph summary of fluorescence intensities from photobleached time-lapse images in presence of fluorogen (n=5). (D) Bar graph summary of fluorescence intensities from images at only two time points after fluorogen removal (n=5). All assays were performed with 100 nM of each fluorogen. Results are mean±s.d.

