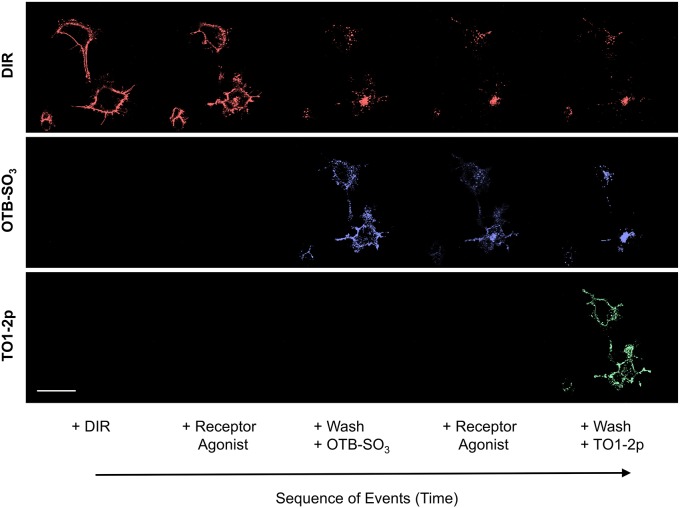
Fig. 5.
Imaging the real-time intracellular trafficking response of cell surface receptors via three-color fluorogen sequential labeling. Mammalian cells expressing HL1.0.1-TO1 fused to ADRB2 at the surface were initially labeled using 100 nM DIR in the medium and subsequently presented with an ADRB2 agonist ligand (isoproterenol). The cells were washed with PBS and labeled with 50 nM OTB-SO3 and the ADRB2 agonist. Then, the cells were washed with PBS and labeled with 500 nM TO1-2p. Each fluorogen time-series micrograph represents multiples images over time. Scale bar: 30 μm.

